Wanna Go For A Drive?
Most of us spend way too much time in our cars—with the average person in America spending about 370 hours on the road each year. But all time isn't equal and 370 hours in one city can be much better—or much worse—than 370 hours in another.
Methodology
Before we jump into it, a quick note on the data: These rankings were calculated in 2024 by WalletHub, based on over 30 different criteria across four main headings: Cost of Ownership & Maintenance, Traffic & Infrastructure, Safety, and Access to Vehicles & Maintenance.
Across these four headings, they looked at everything from fuel and insurance prices to time spent in traffic and road quality. They also took into consideration the likelihood of accidents, car theft rates, and hard-braking events per 1,000 miles. The number of gas stations, auto repair shops, and parking lots per capita were also factored into the final weighted average score for each city. 100 cities were ranked and these are the top 20 and the bottom 20 in said ranking (with numbers 1-20 being the best and 80-100 being the worst).
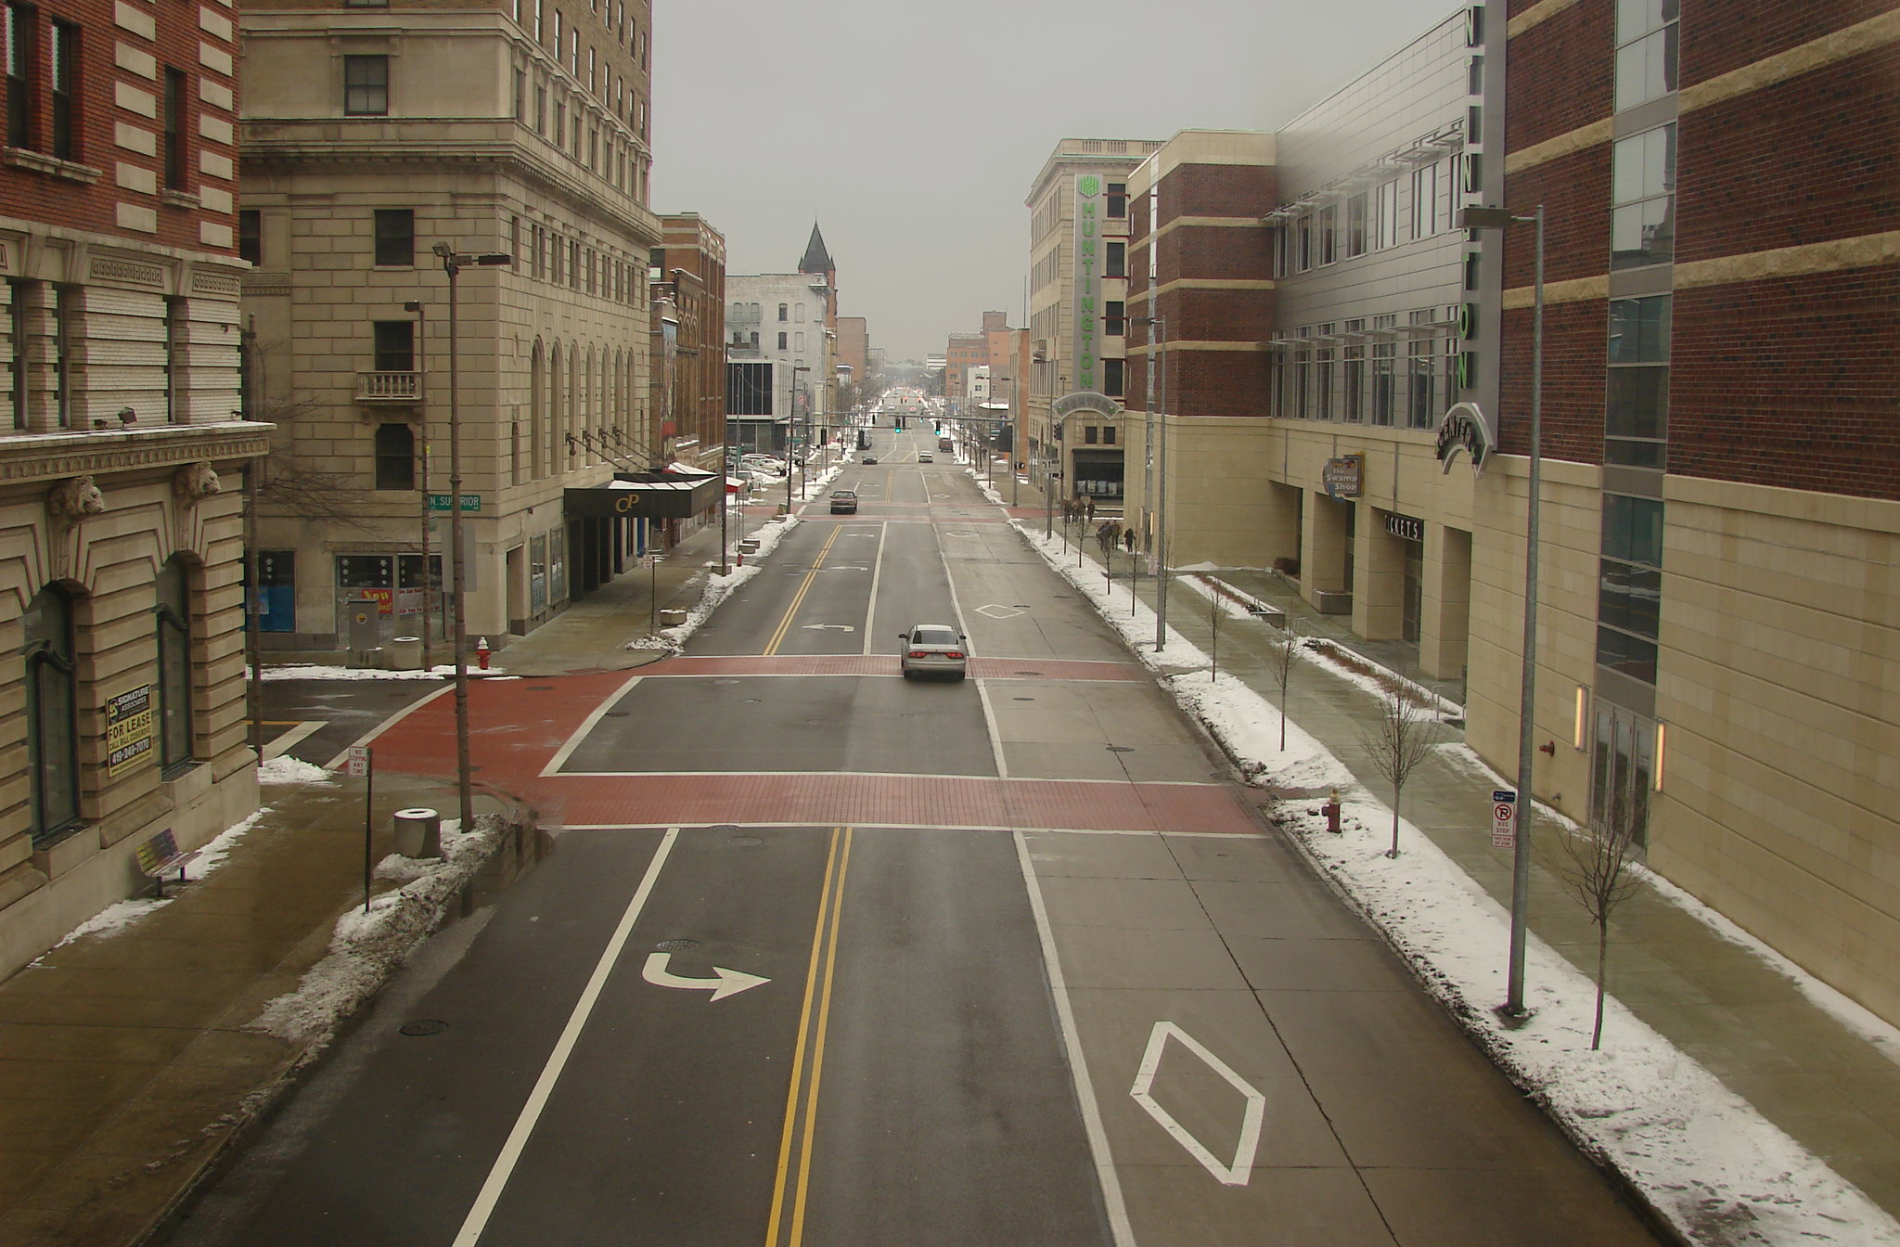
#20: Toledo, OH (58.02)
Cost of Ownership & Maintenance: 5
Traffic & Infrastructure: 40
Safety: 66
Access to Vehicles & Maintenance: 71
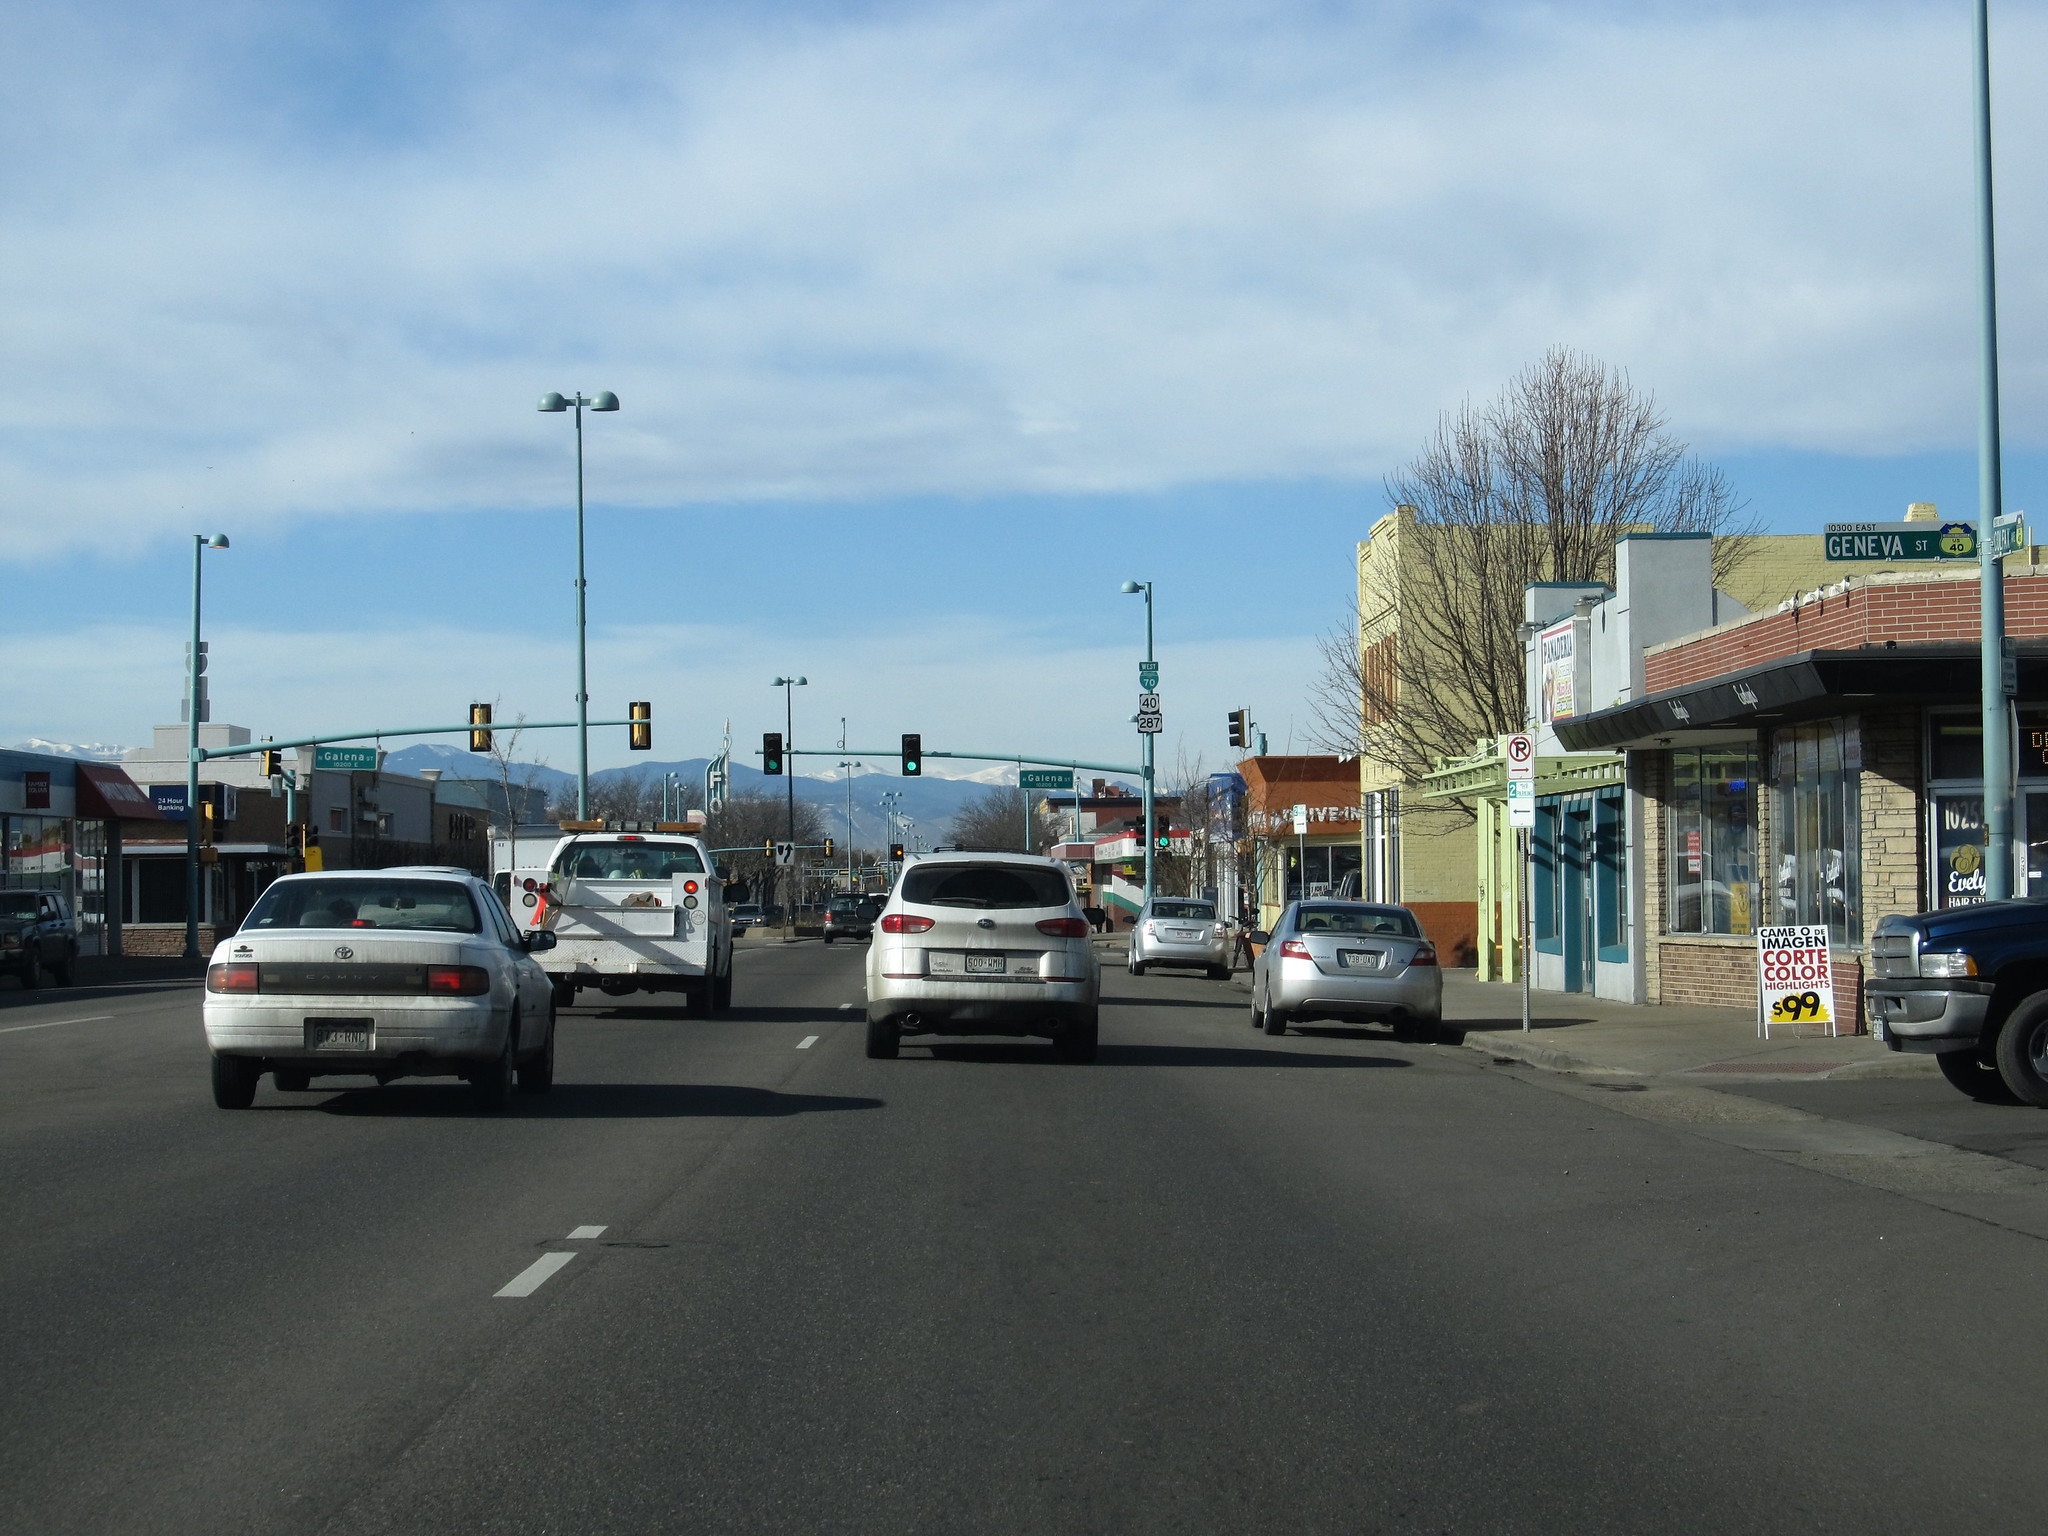
#80: Aurora, CO (46.1)
Cost of Ownership & Maintenance: 55
Traffic & Infrastructure: 90
Safety: 83
Access to Vehicles & Maintenance: 77
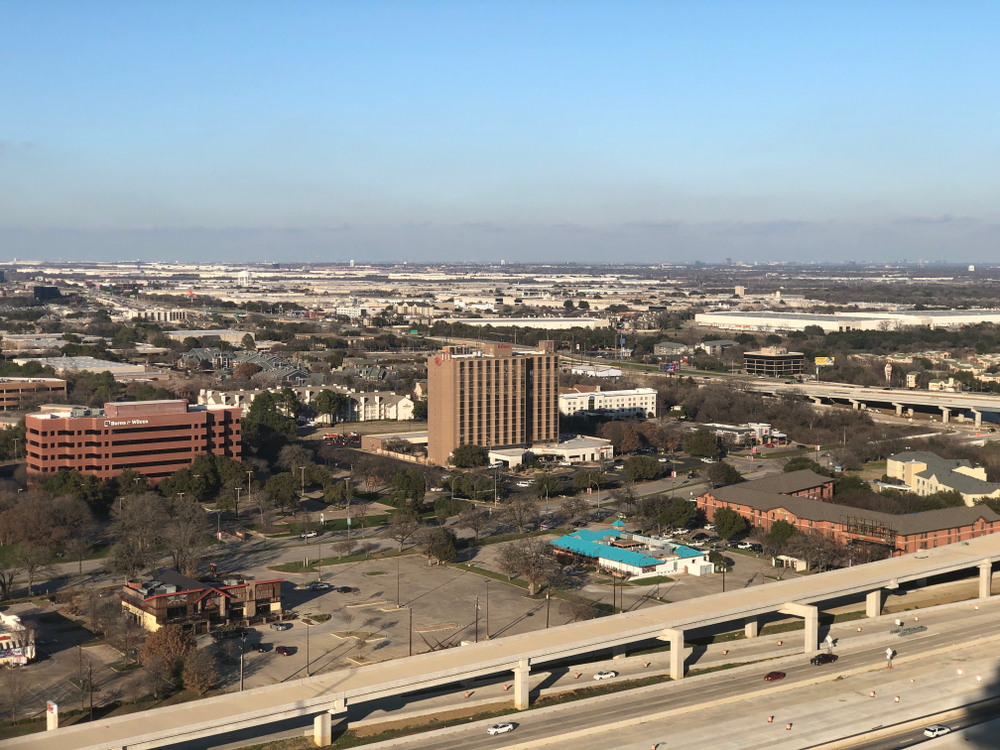
#19: Arlington, TX (58.46)
Cost of Ownership & Maintenance: 30
Traffic & Infrastructure: 60
Safety: 26
Access to Vehicles & Maintenance: 22
#81: Stockton, CA (45.95)
Cost of Ownership & Maintenance: 85
Traffic & Infrastructure: 54
Safety: 43
Access to Vehicles & Maintenance: 82
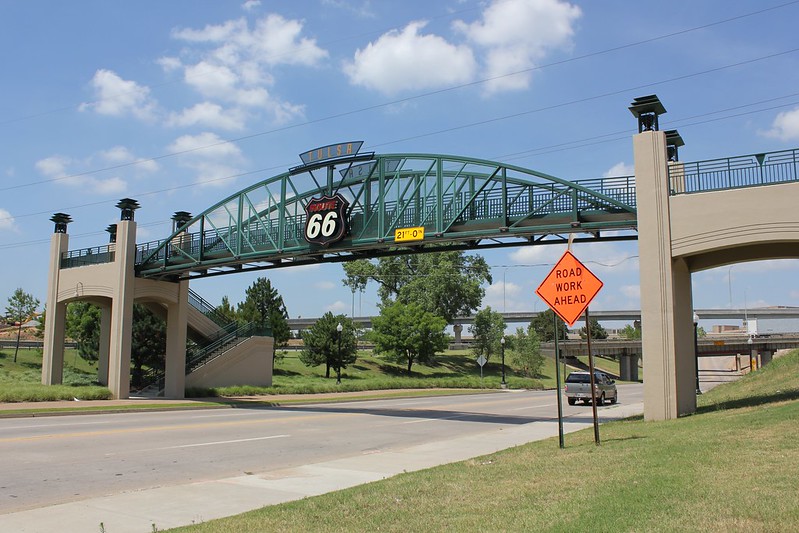
#18: Tulsa, OK (58.82)
Cost of Ownership & Maintenance: 41
Traffic & Infrastructure: 5
Safety: 51
Access to Vehicles & Maintenance: 40
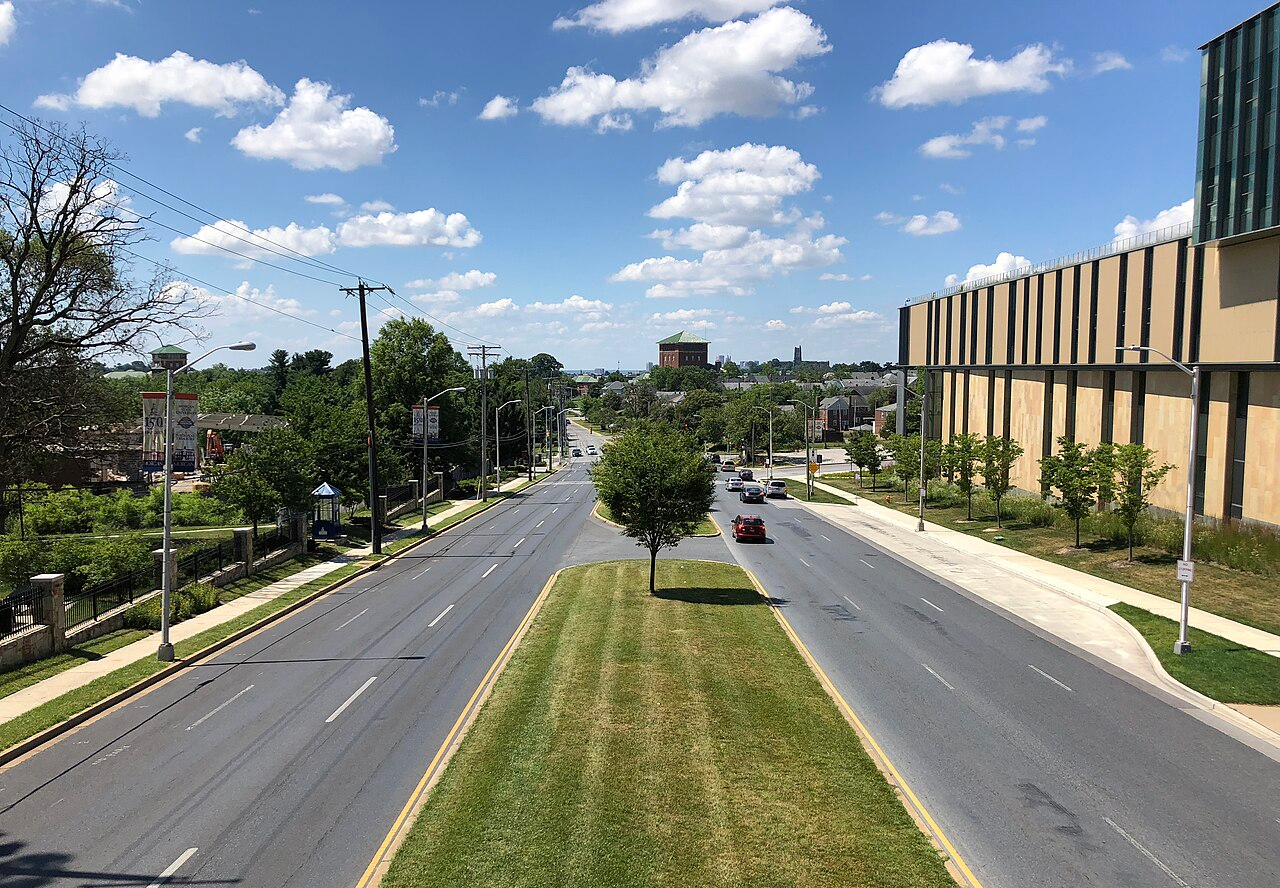
#82: Baltimore, MD (45.61)
Cost of Ownership & Maintenance: 63
Traffic & Infrastructure: 83
Safety: 80
Access to Vehicles & Maintenance: 73
 Famartin, CC BY-SA 4.0, Wikimedia Commons
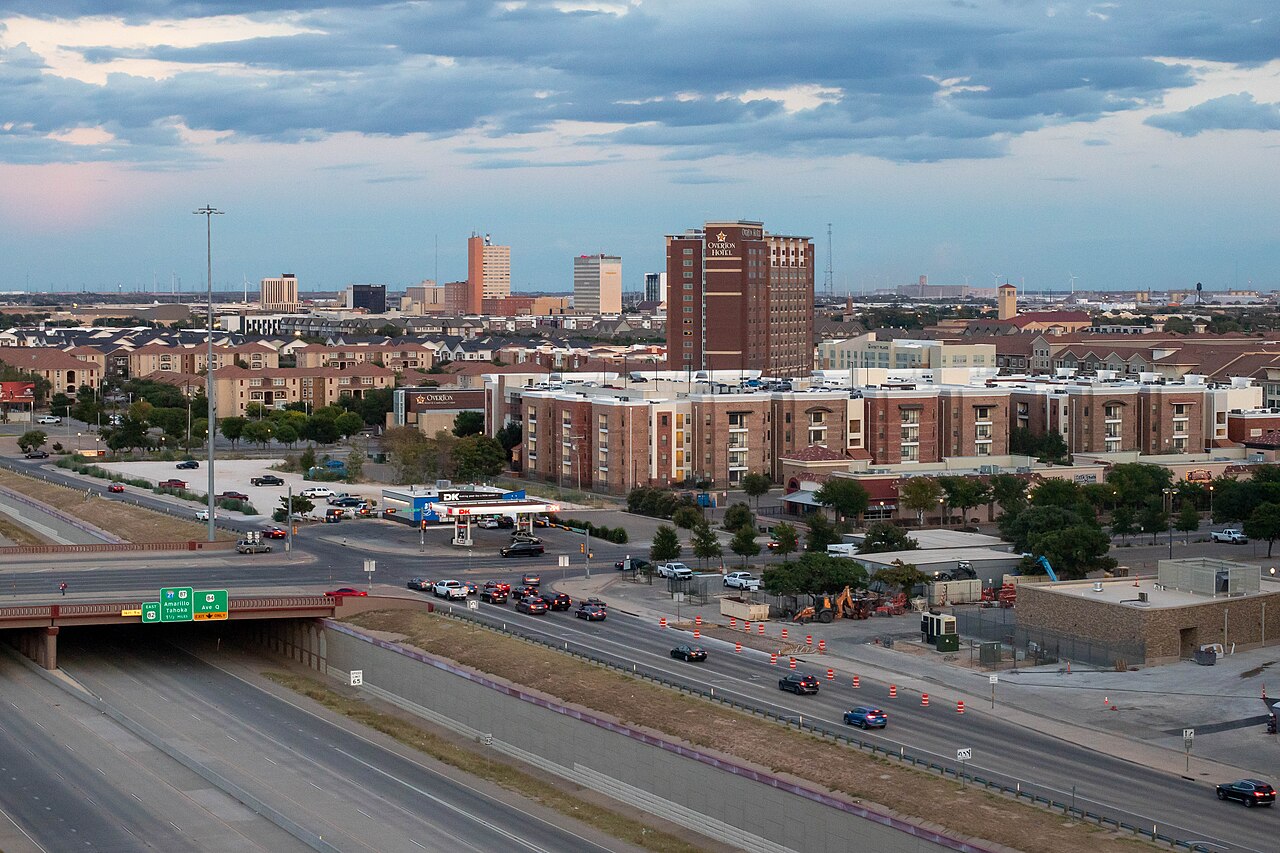
#17: Lubbock, TX (58.94)
Cost of Ownership & Maintenance: 35
Traffic & Infrastructure: 3
Safety: 60
Access to Vehicles & Maintenance: 67
 Noah Puente, CC0, Wikimedia Commons
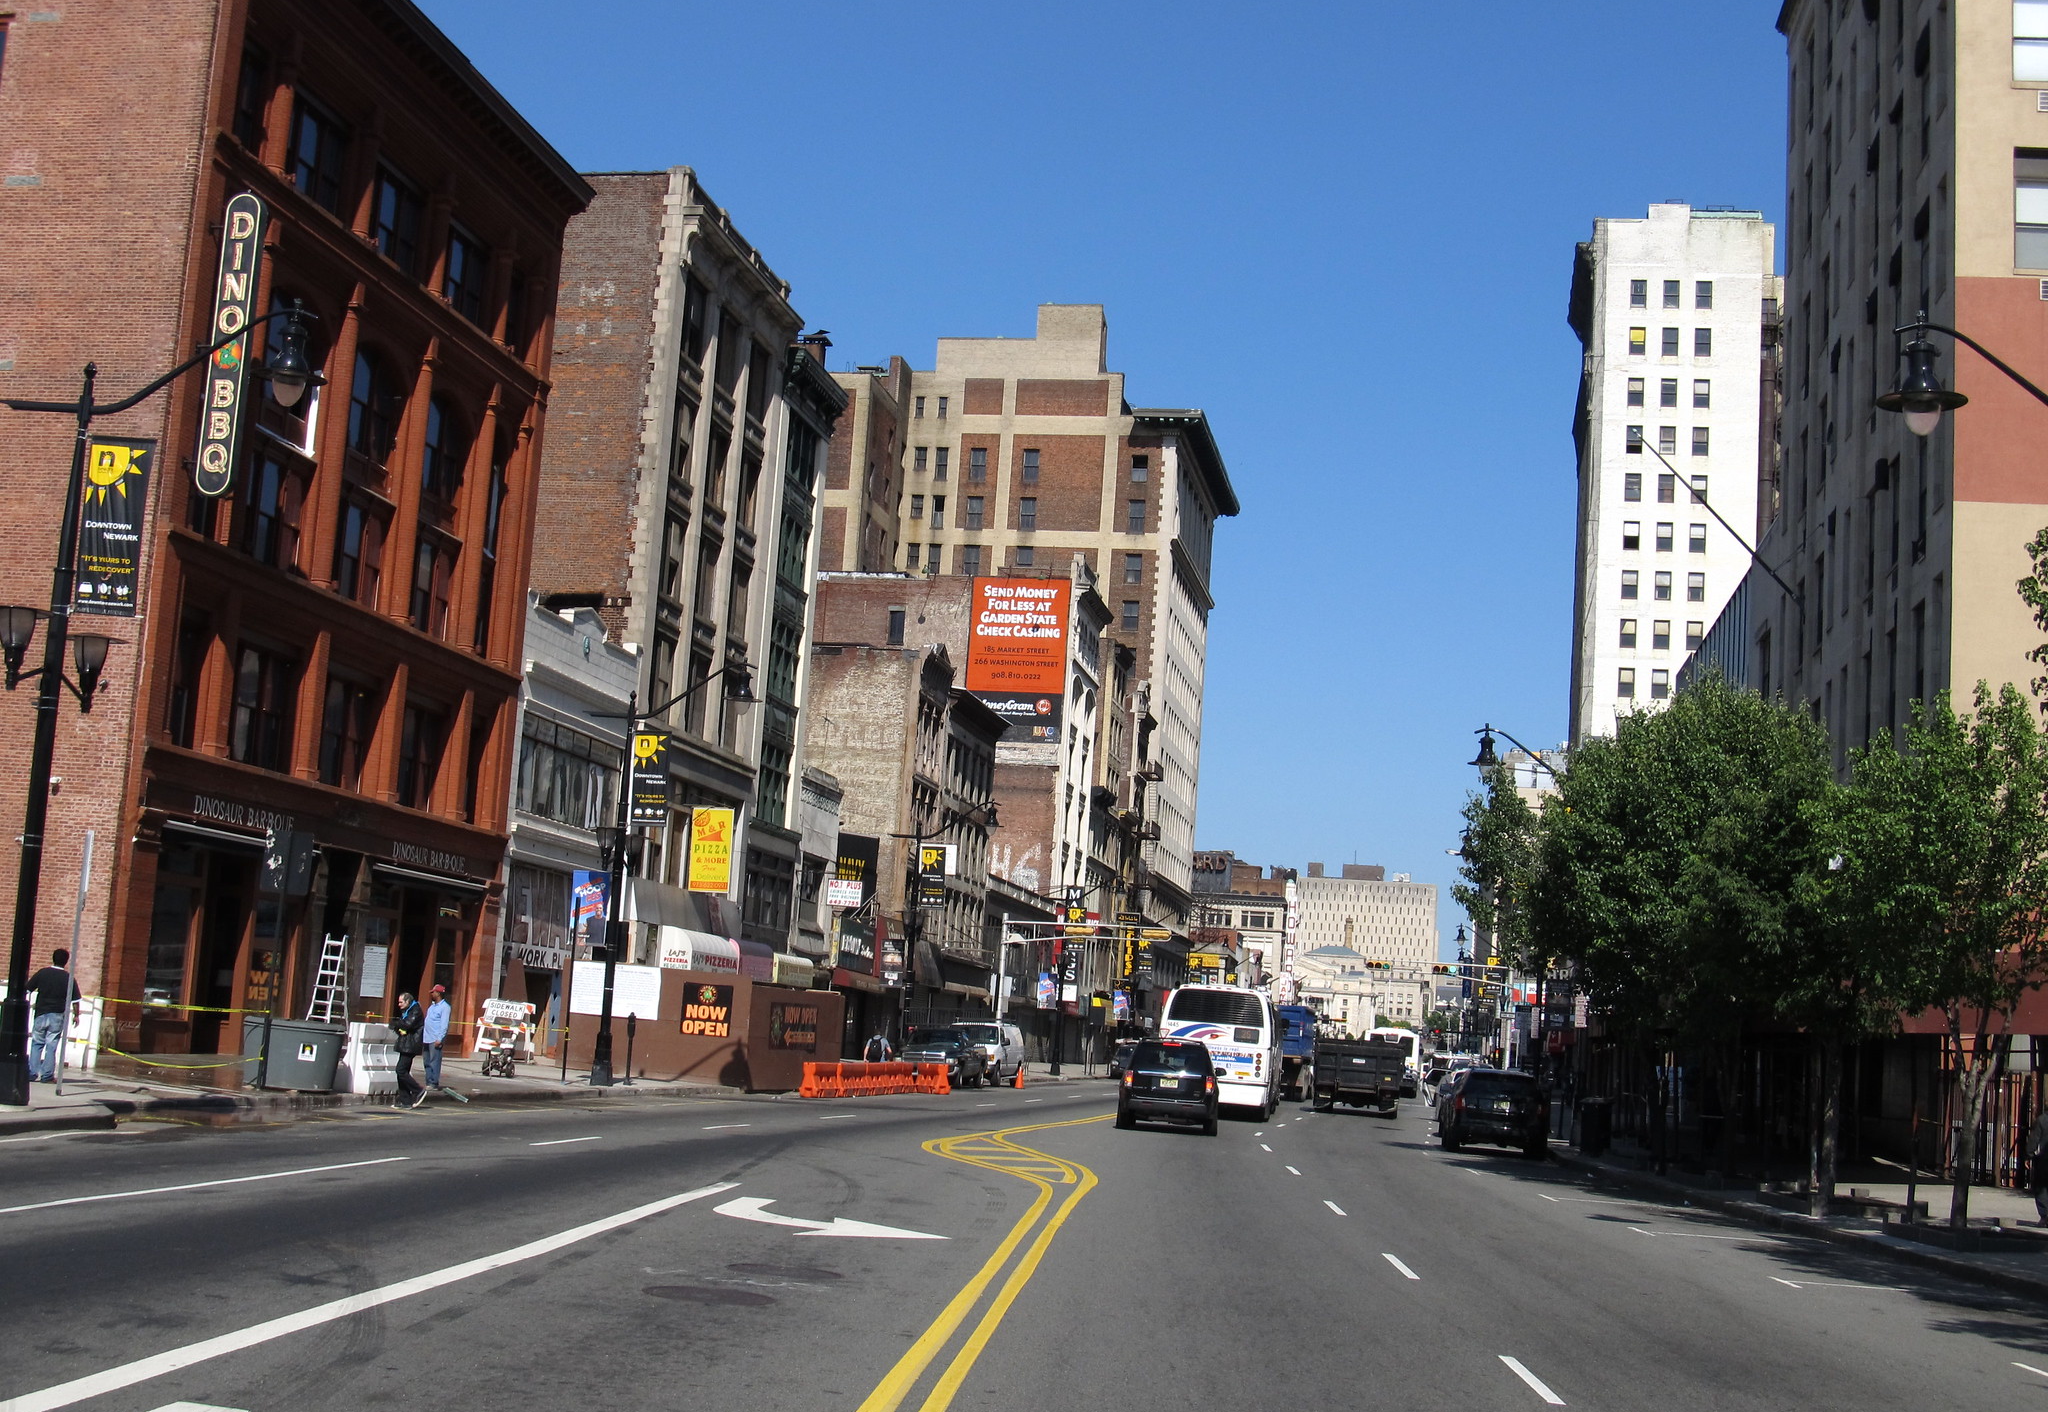
#83: Newark, NJ (45.24)
Cost of Ownership & Maintenance: 73
Traffic & Infrastructure: 95
Safety: 55
Access to Vehicles & Maintenance: 21
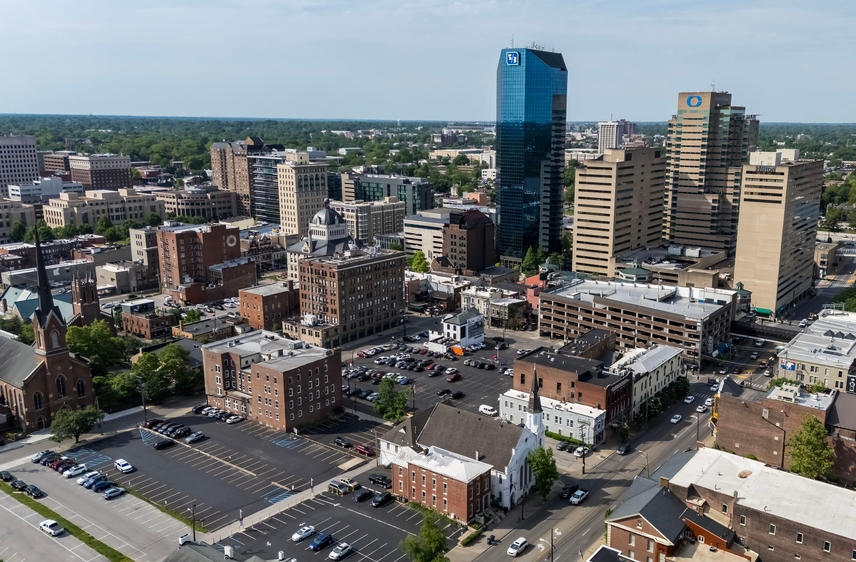
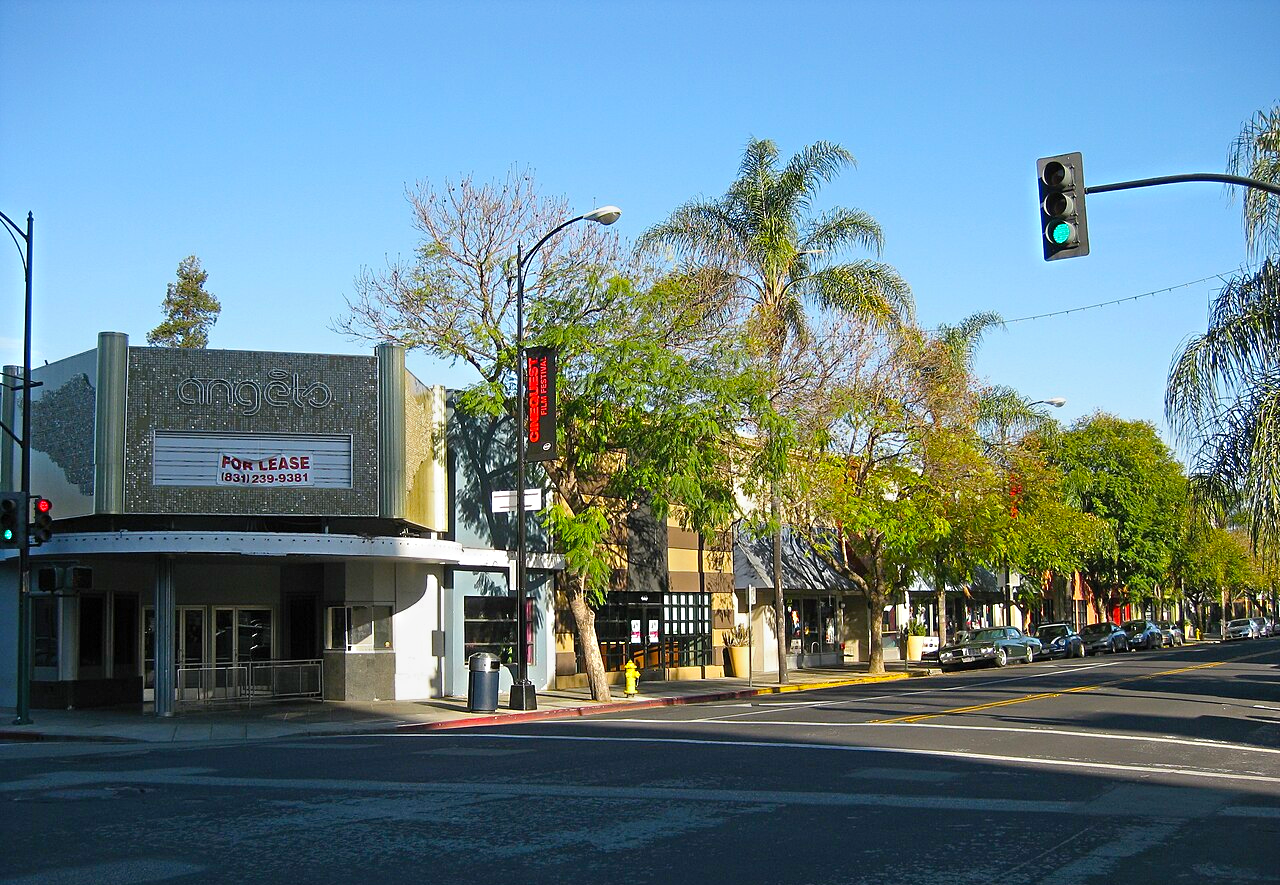
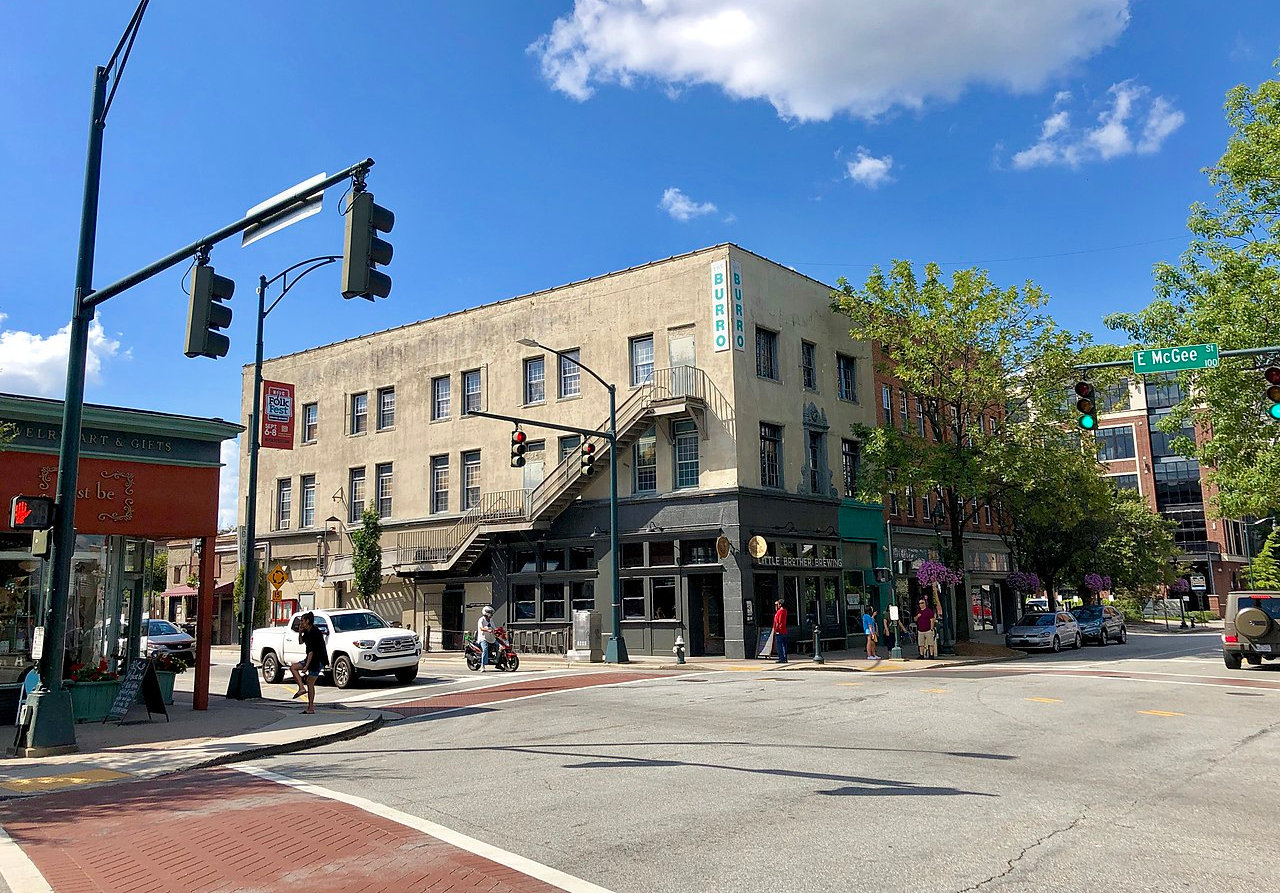
#16: Lexington-Fayette, KY (58.96)
Cost of Ownership & Maintenance: 6
Traffic & Infrastructure: 43
Safety: 31
Access to Vehicles & Maintenance: 95
 Grindstone Media Group, Shutterstock
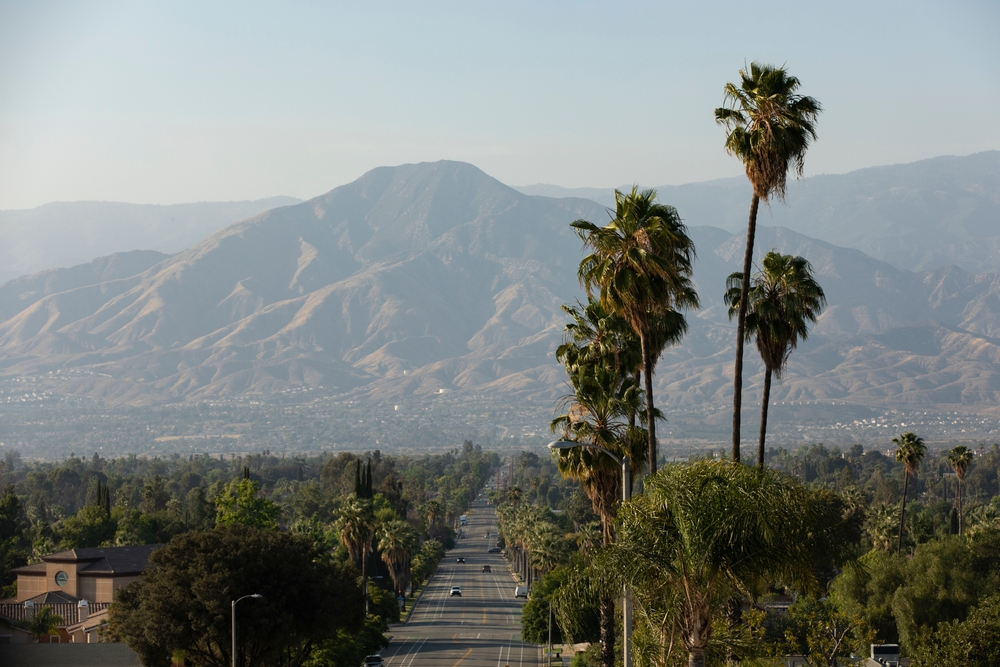
#84: San Bernardino, CA (45.16)
Cost of Ownership & Maintenance: 93
Traffic & Infrastructure: 22
Safety: 74
Access to Vehicles & Maintenance: 42
#15: Durham, NC (59.10)
Cost of Ownership & Maintenance: 7
Traffic & Infrastructure: 44
Safety: 32
Access to Vehicles & Maintenance: 85
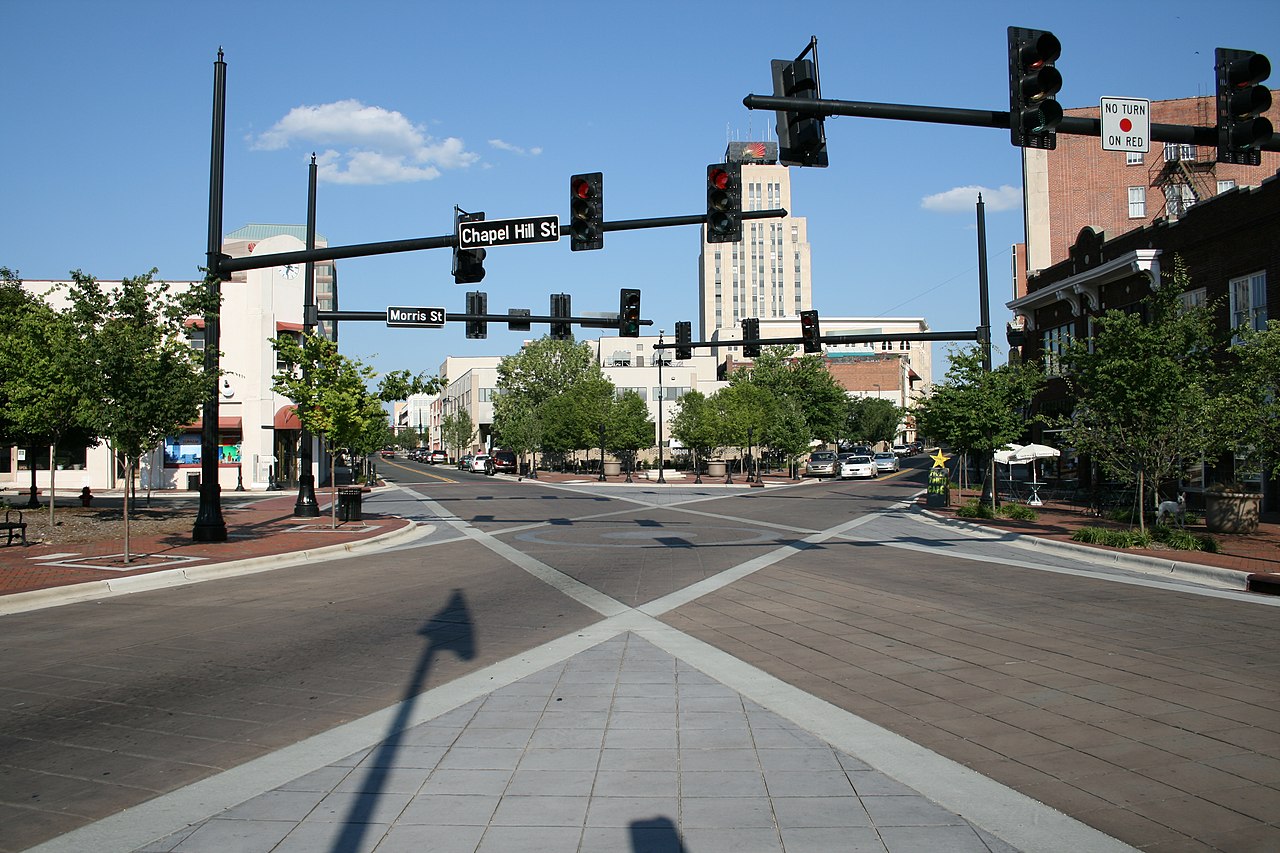 Ildar Sagdejev, CC BY-SA 3.0, Wikimedia Commons
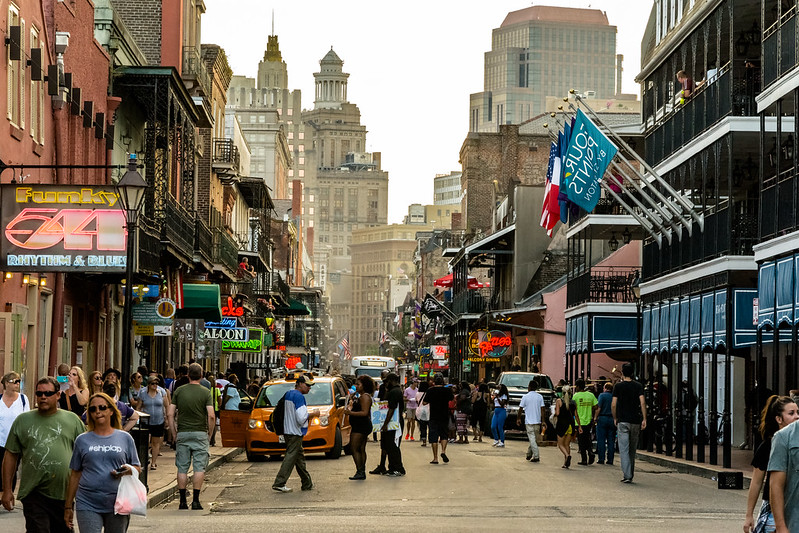
#85: New Orleans, LA (45.16)
Cost of Ownership & Maintenance: 65
Traffic & Infrastructure: 76
Safety: 84
Access to Vehicles & Maintenance: 96
#14: Fort Wayne, IN (59.14)
Cost of Ownership & Maintenance: 23
Traffic & Infrastructure: 39
Safety: 21
Access to Vehicles & Maintenance: 64
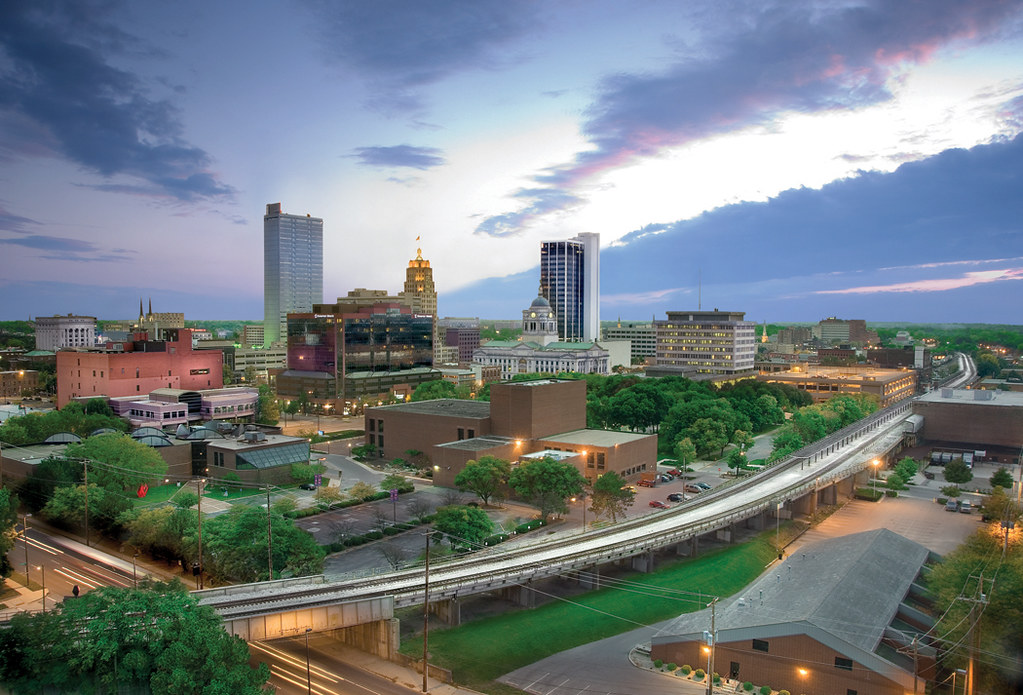 Northeast Indiana Regional Partnership, Flickr
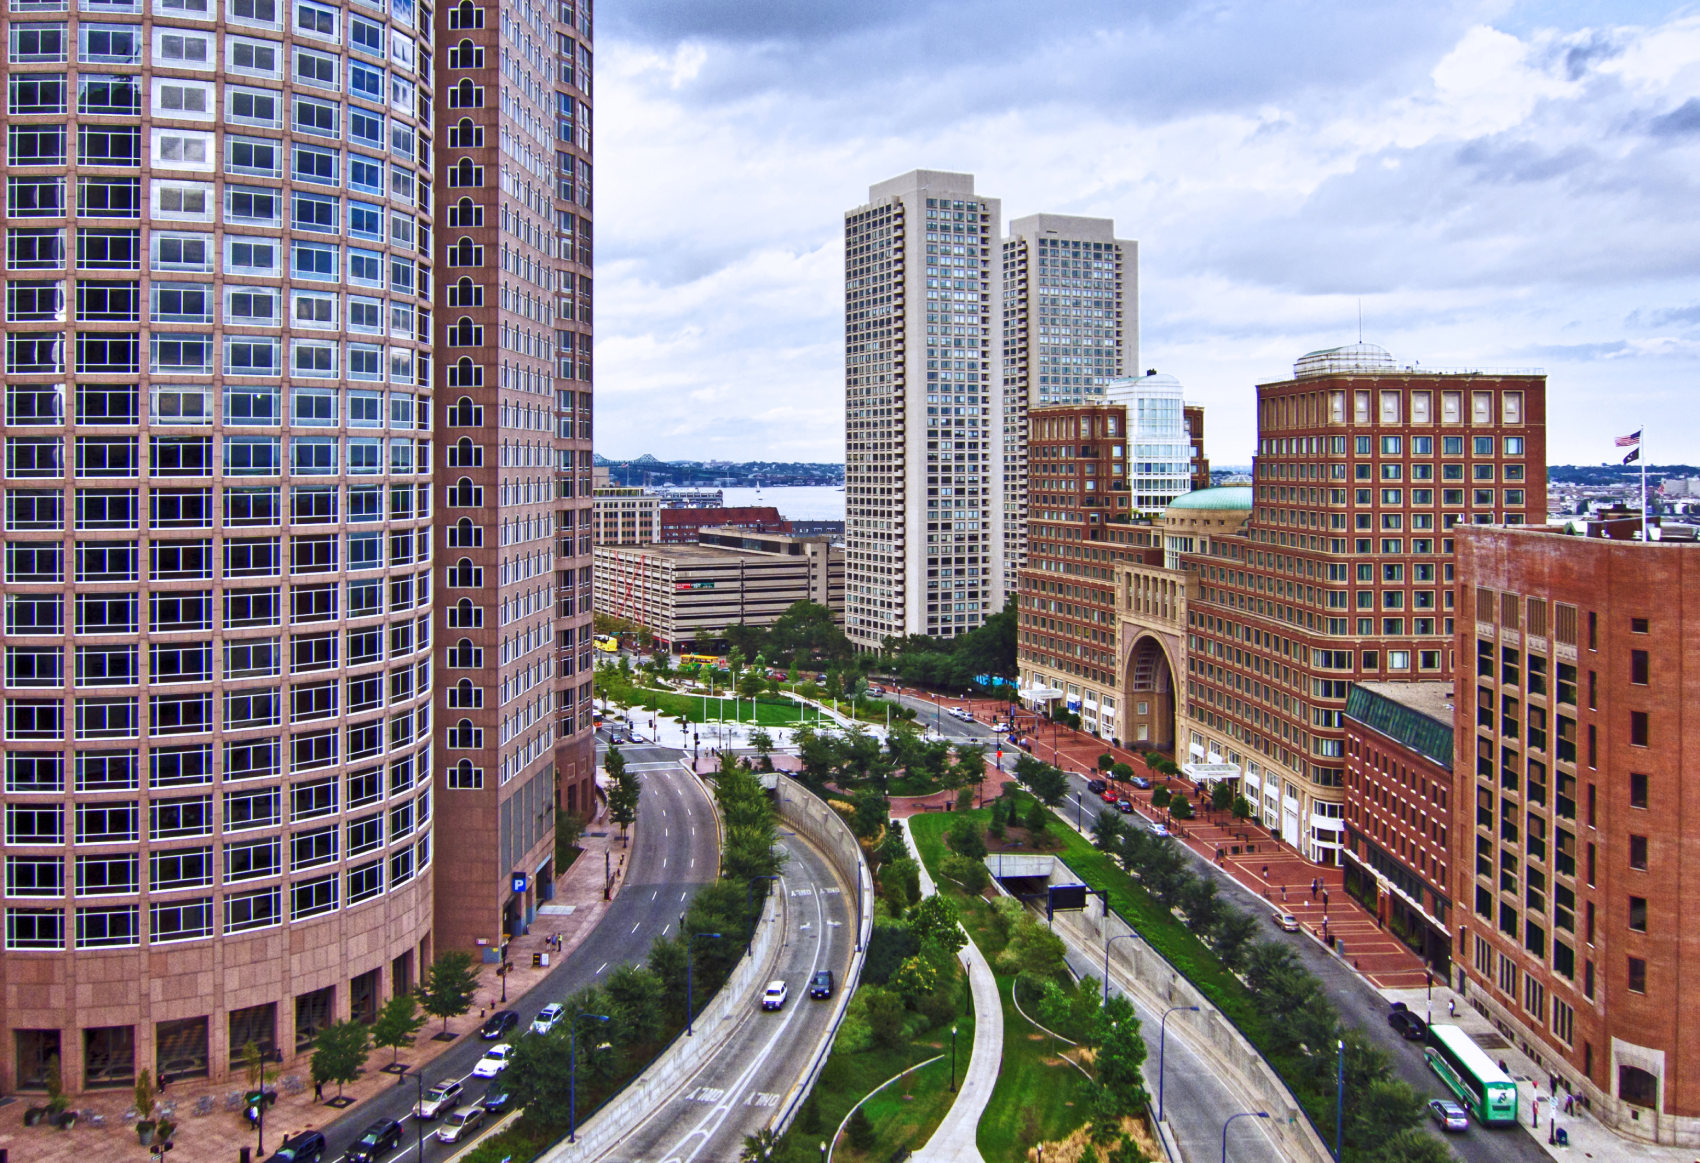
#86: Boston, MA (45.15)
Cost of Ownership & Maintenance: 68
Traffic & Infrastructure: 94
Safety: 35
Access to Vehicles & Maintenance: 87
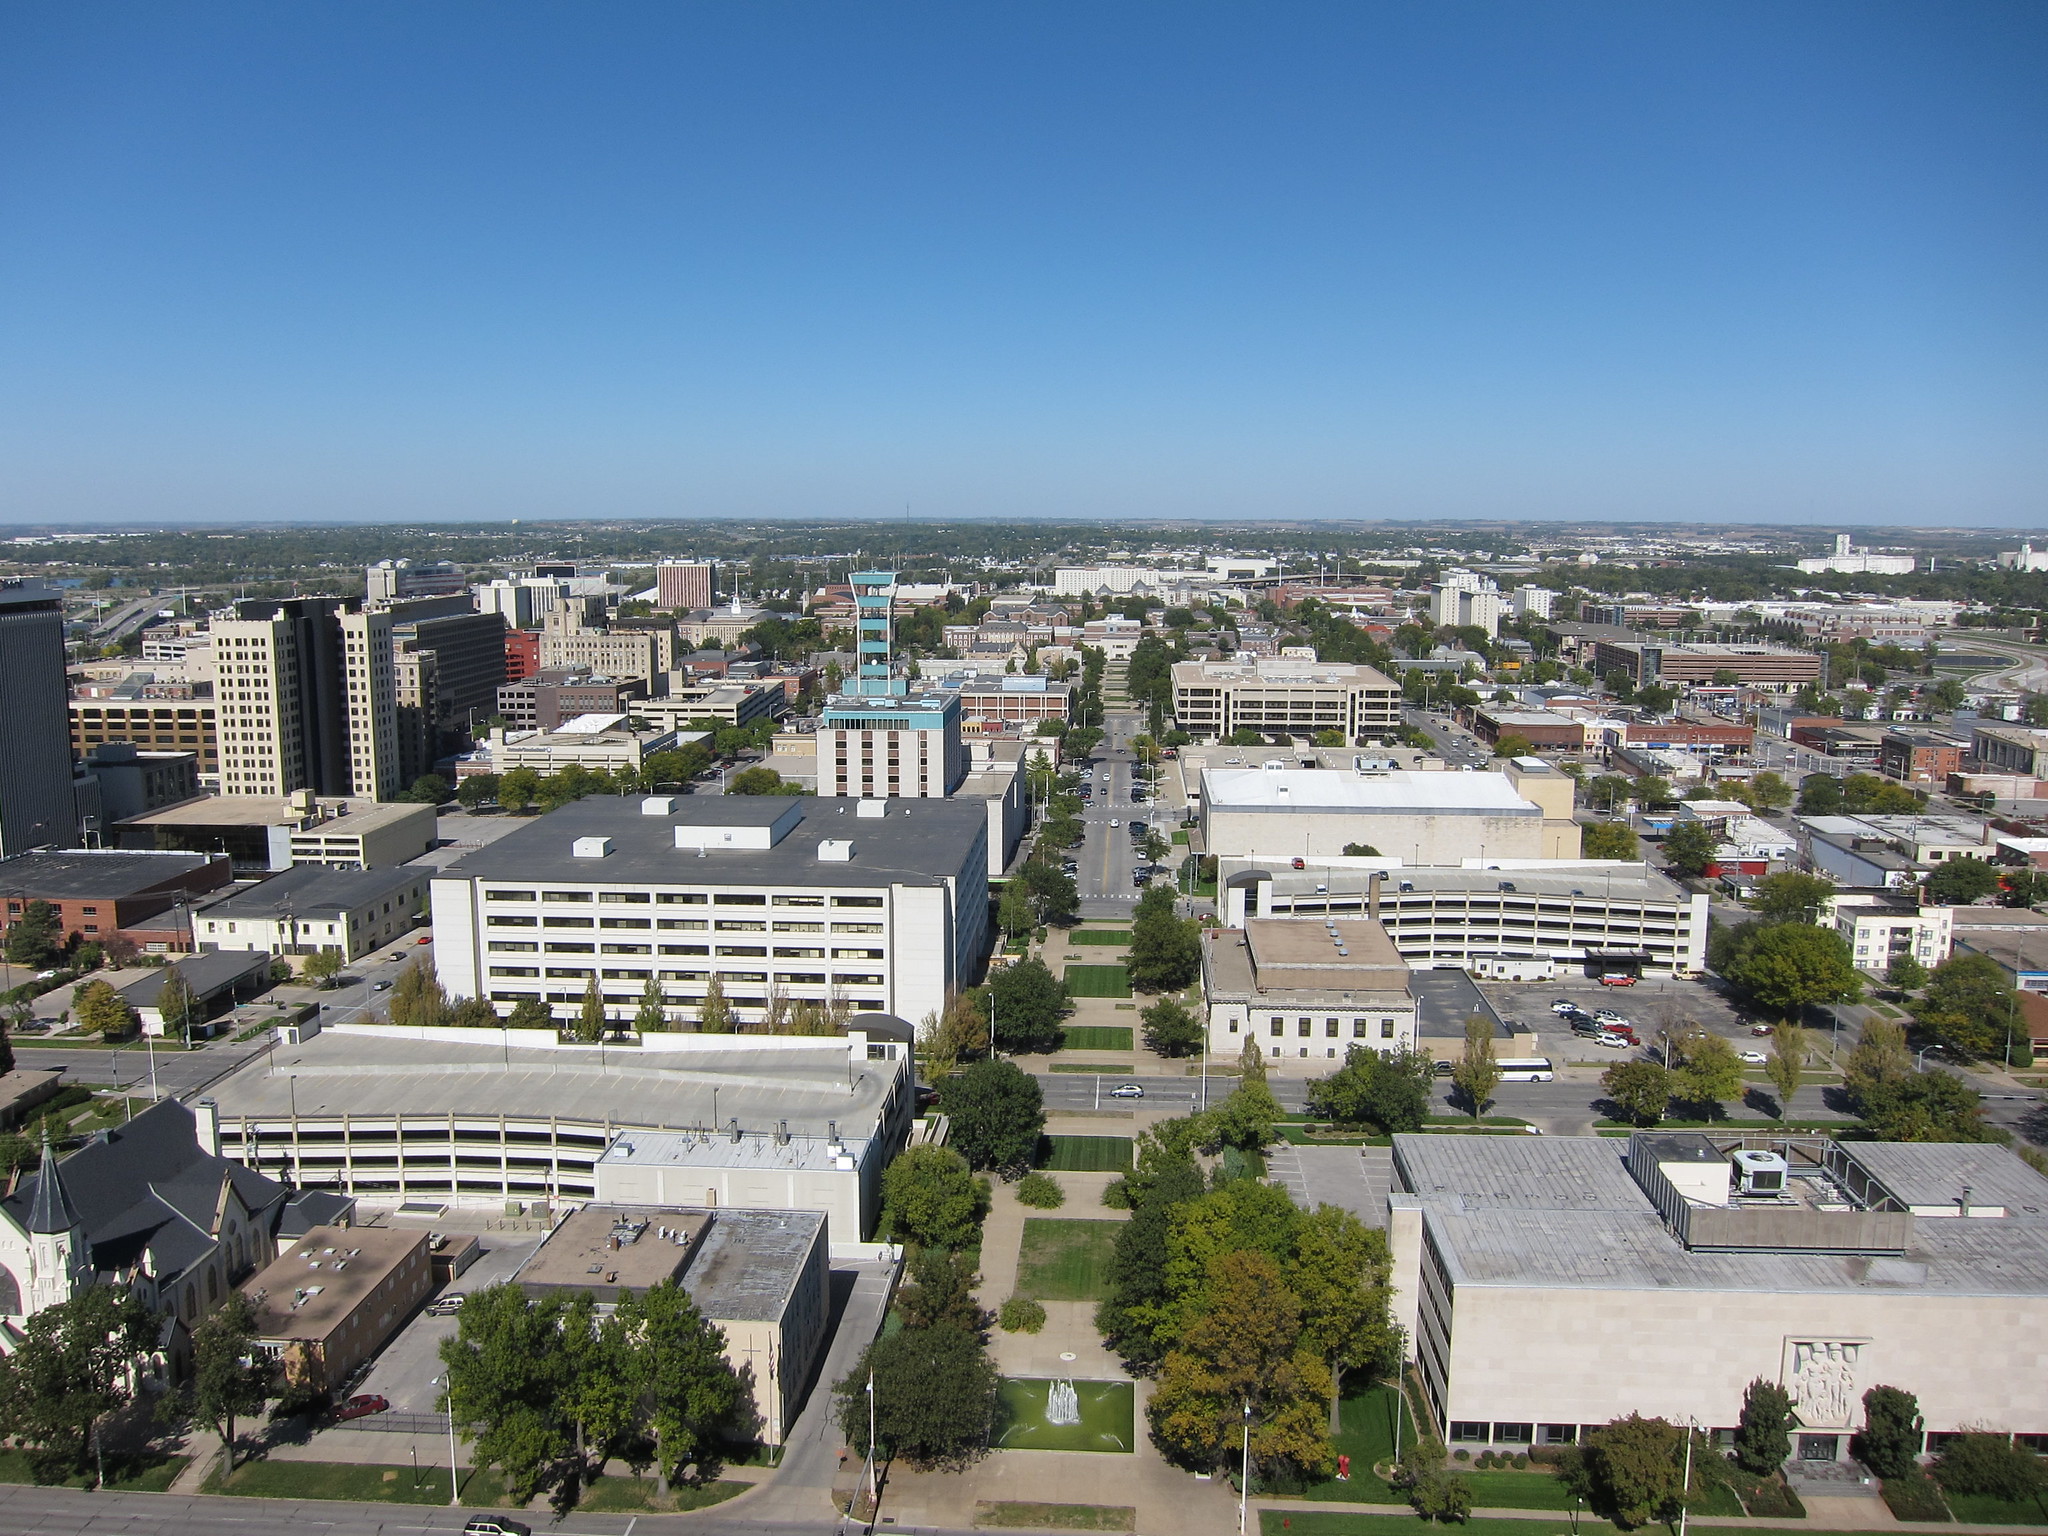
#13: Lincoln, NE (59.32)
Cost of Ownership & Maintenance: 18
Traffic & Infrastructure: 52
Safety: 12
Access to Vehicles & Maintenance: 89
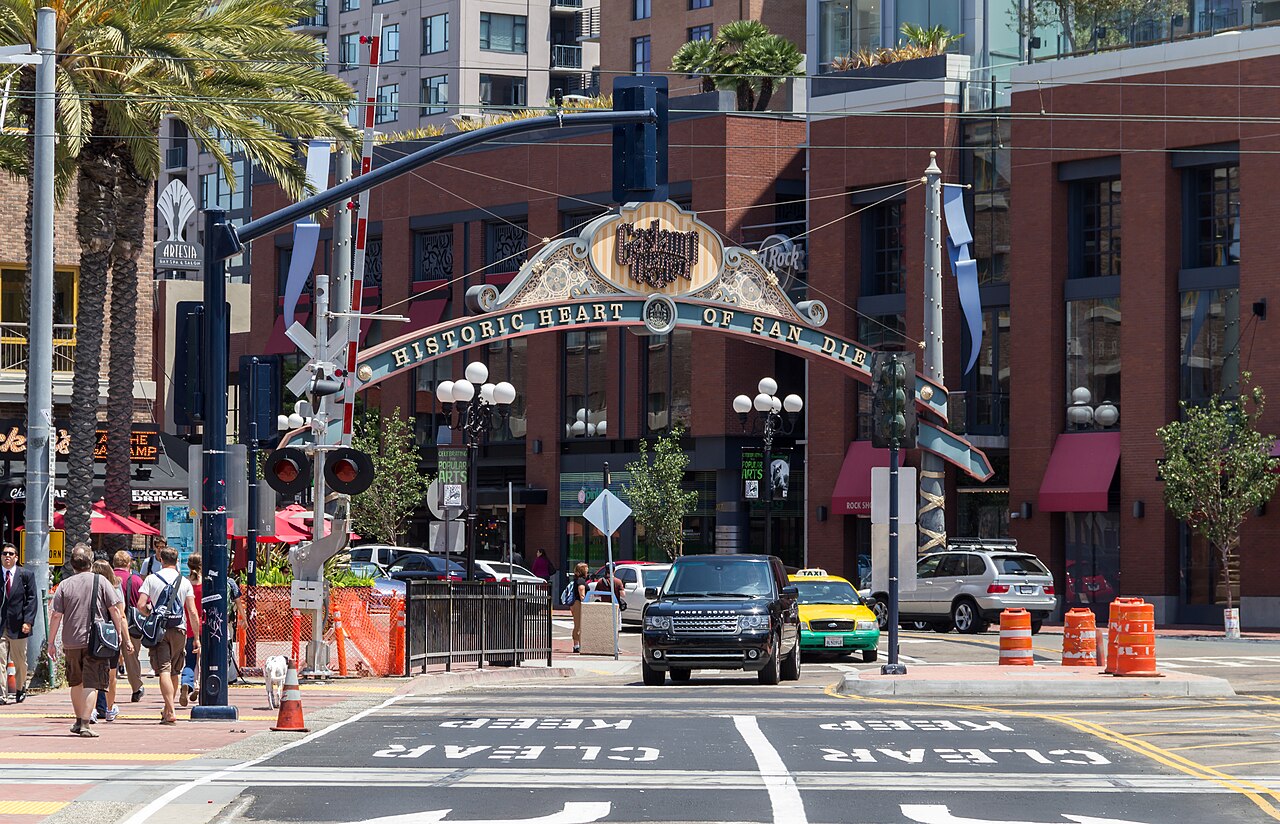
#87: San Diego, CA (45.04)
Cost of Ownership & Maintenance: 95
Traffic & Infrastructure: 51
Safety: 30
Access to Vehicles & Maintenance: 29
 Dietmar Rabich, CC BY-SA 4.0, Wikimedia Commons
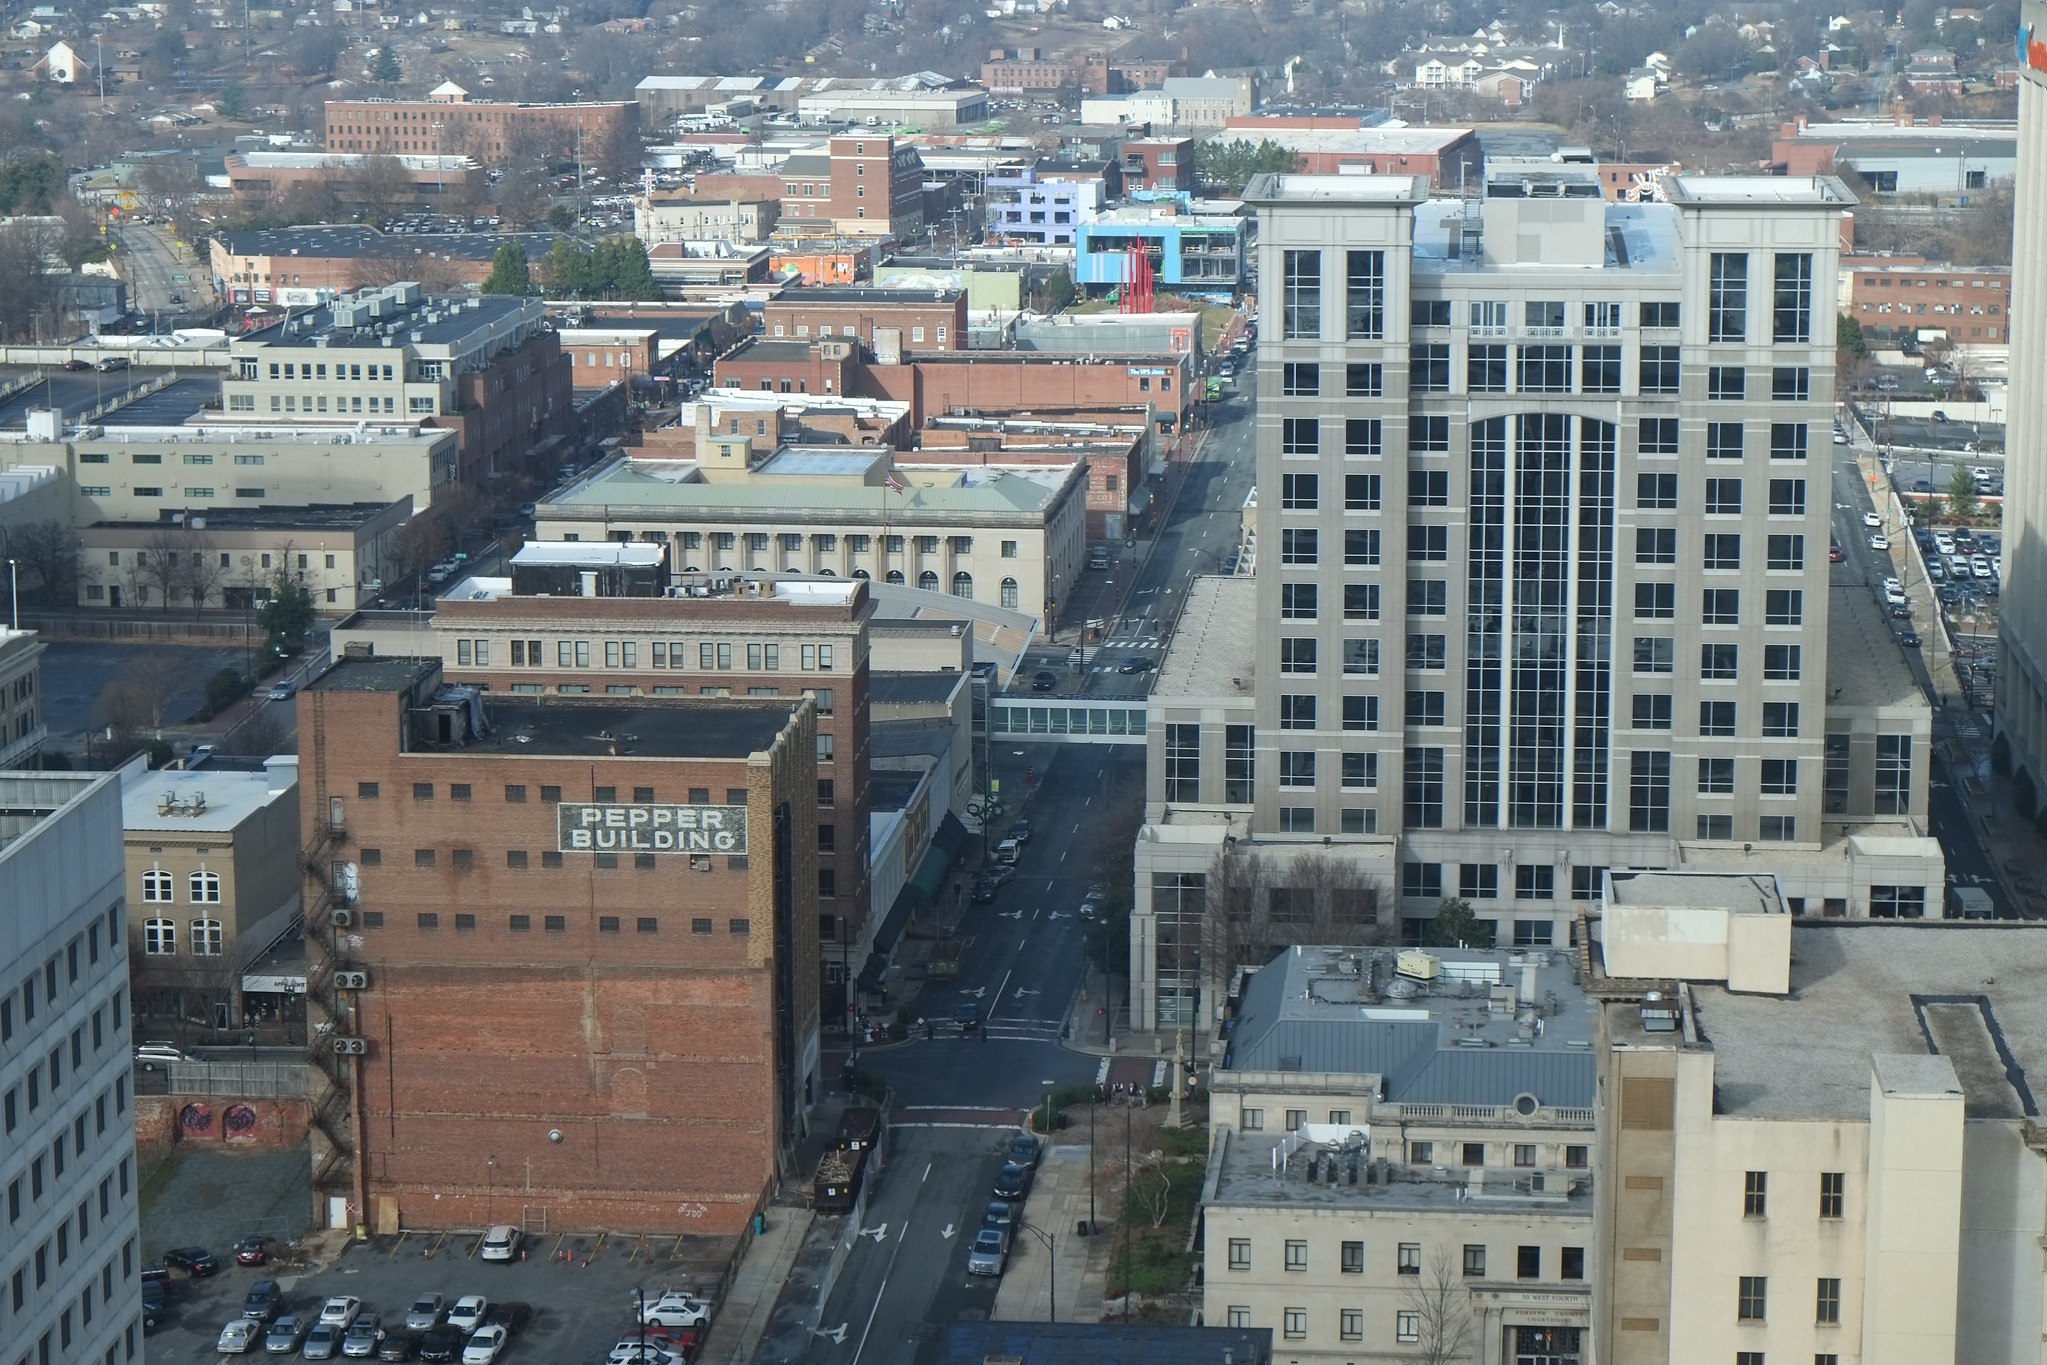
#12: Winston-Salem, NC (60.05)
Cost of Ownership & Maintenance: 3
Traffic & Infrastructure: 26
Safety: 40
Access to Vehicles & Maintenance: 94
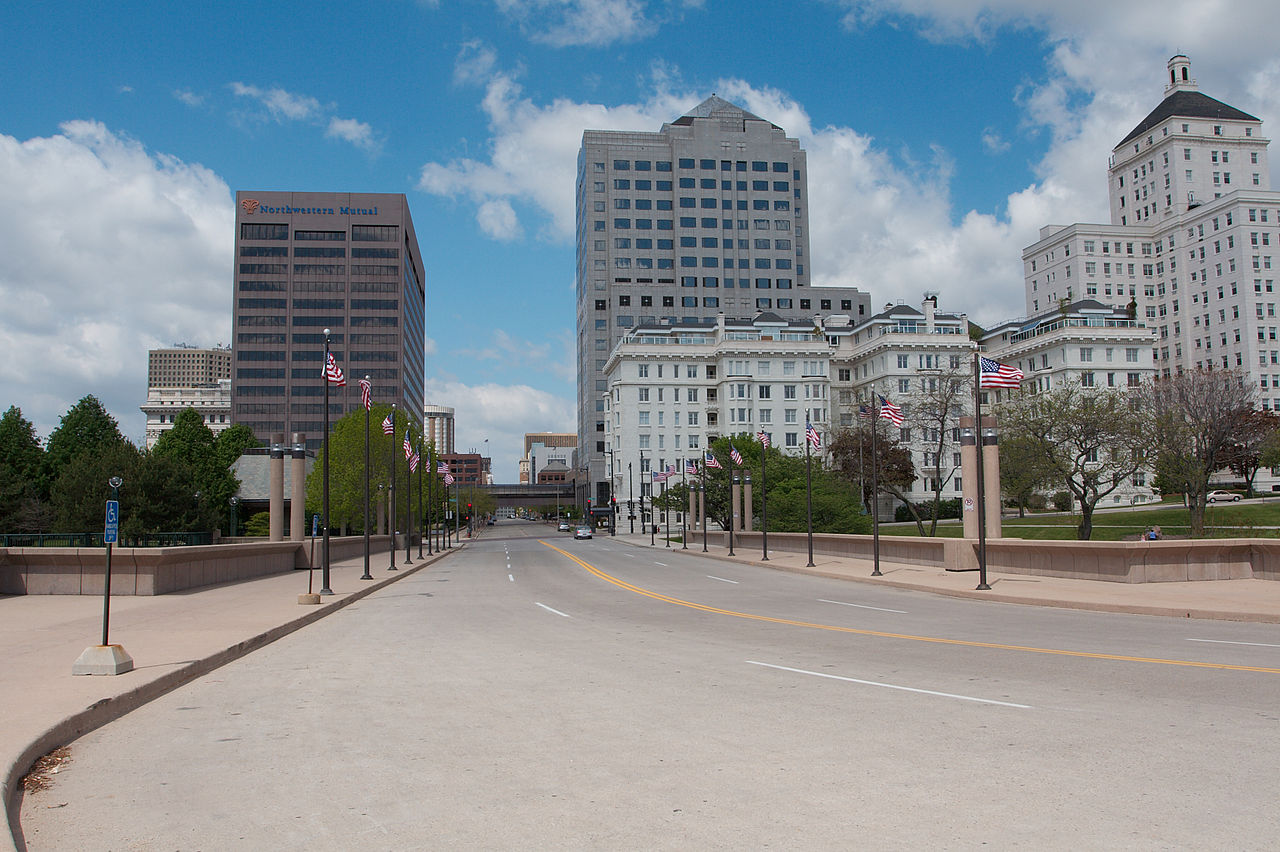
#88: Milwaukee, WI (44.22)
Cost of Ownership & Maintenance: 70
Traffic & Infrastructure: 85
Safety: 82
Access to Vehicles & Maintenance: 61
 Dori, CC BY-SA 3.0, Wikimedia Commons
#11: Birmingham, AL (60.17)
Cost of Ownership & Maintenance: 8
Traffic & Infrastructure: 10
Safety: 87
Access to Vehicles & Maintenance: 8
 Bjoertvedt, CC BY-SA 4.0, Wikimedia Commons
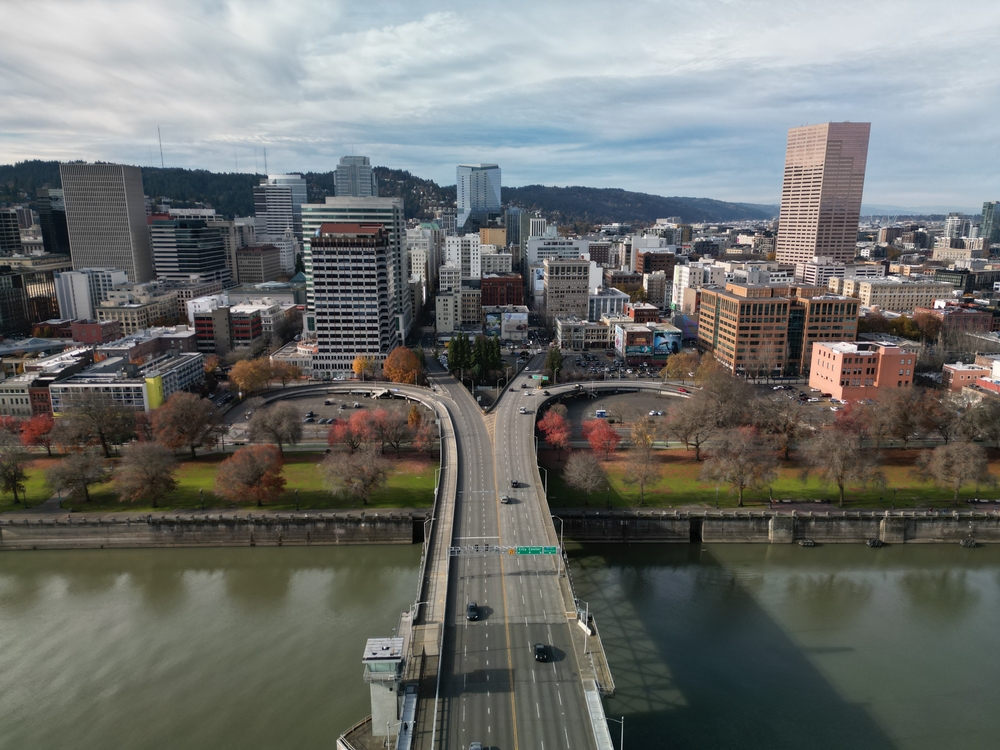
#89: Portland, OR (44.00)
Cost of Ownership & Maintenance: 75
Traffic & Infrastructure: 86
Safety: 78
Access to Vehicles & Maintenance: 38
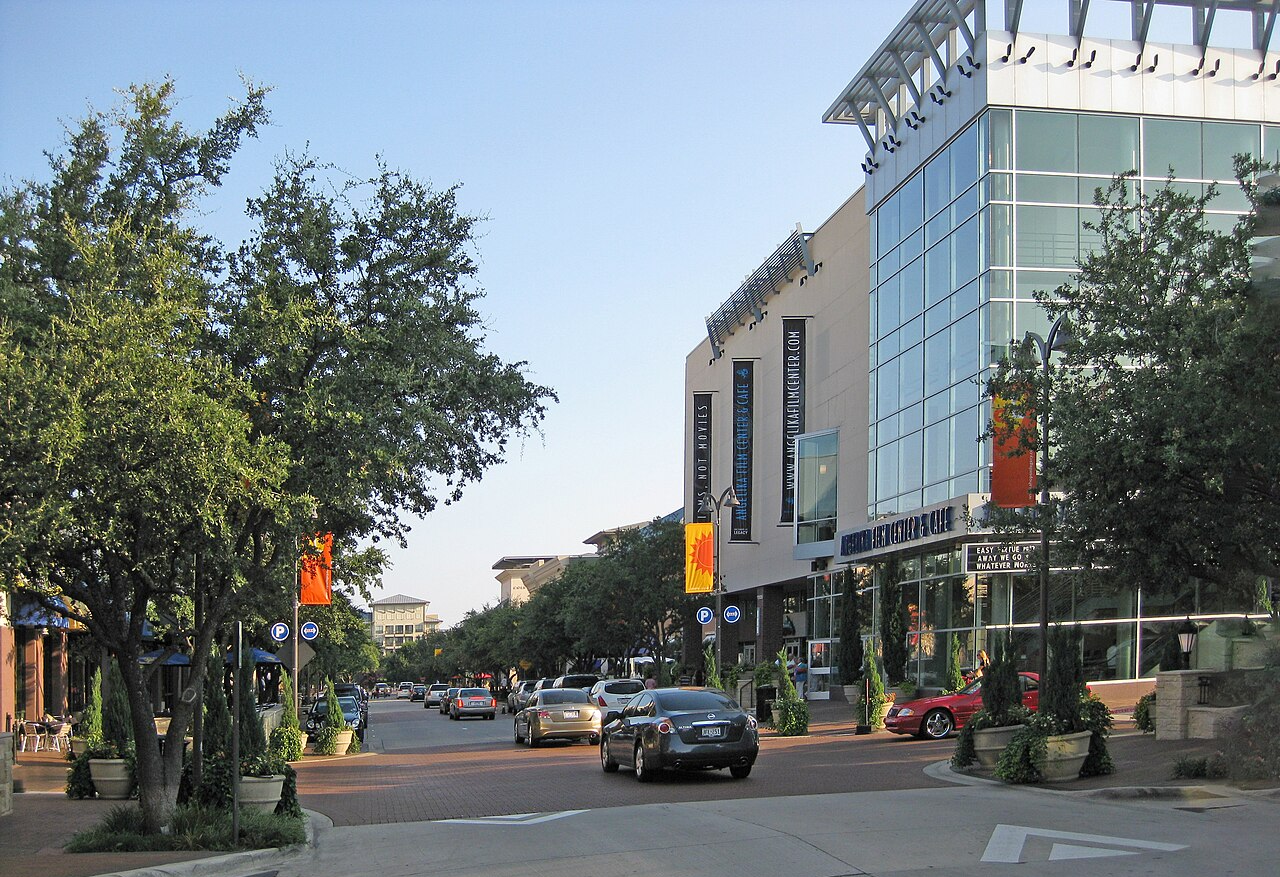
#10: Plano, TX (60.52)
Cost of Ownership & Maintenance: 40
Traffic & Infrastructure: 37
Safety: 13
Access to Vehicles & Maintenance: 28
 Eric Fredericks, CC BY-SA 2.0, Wikimedia Commons
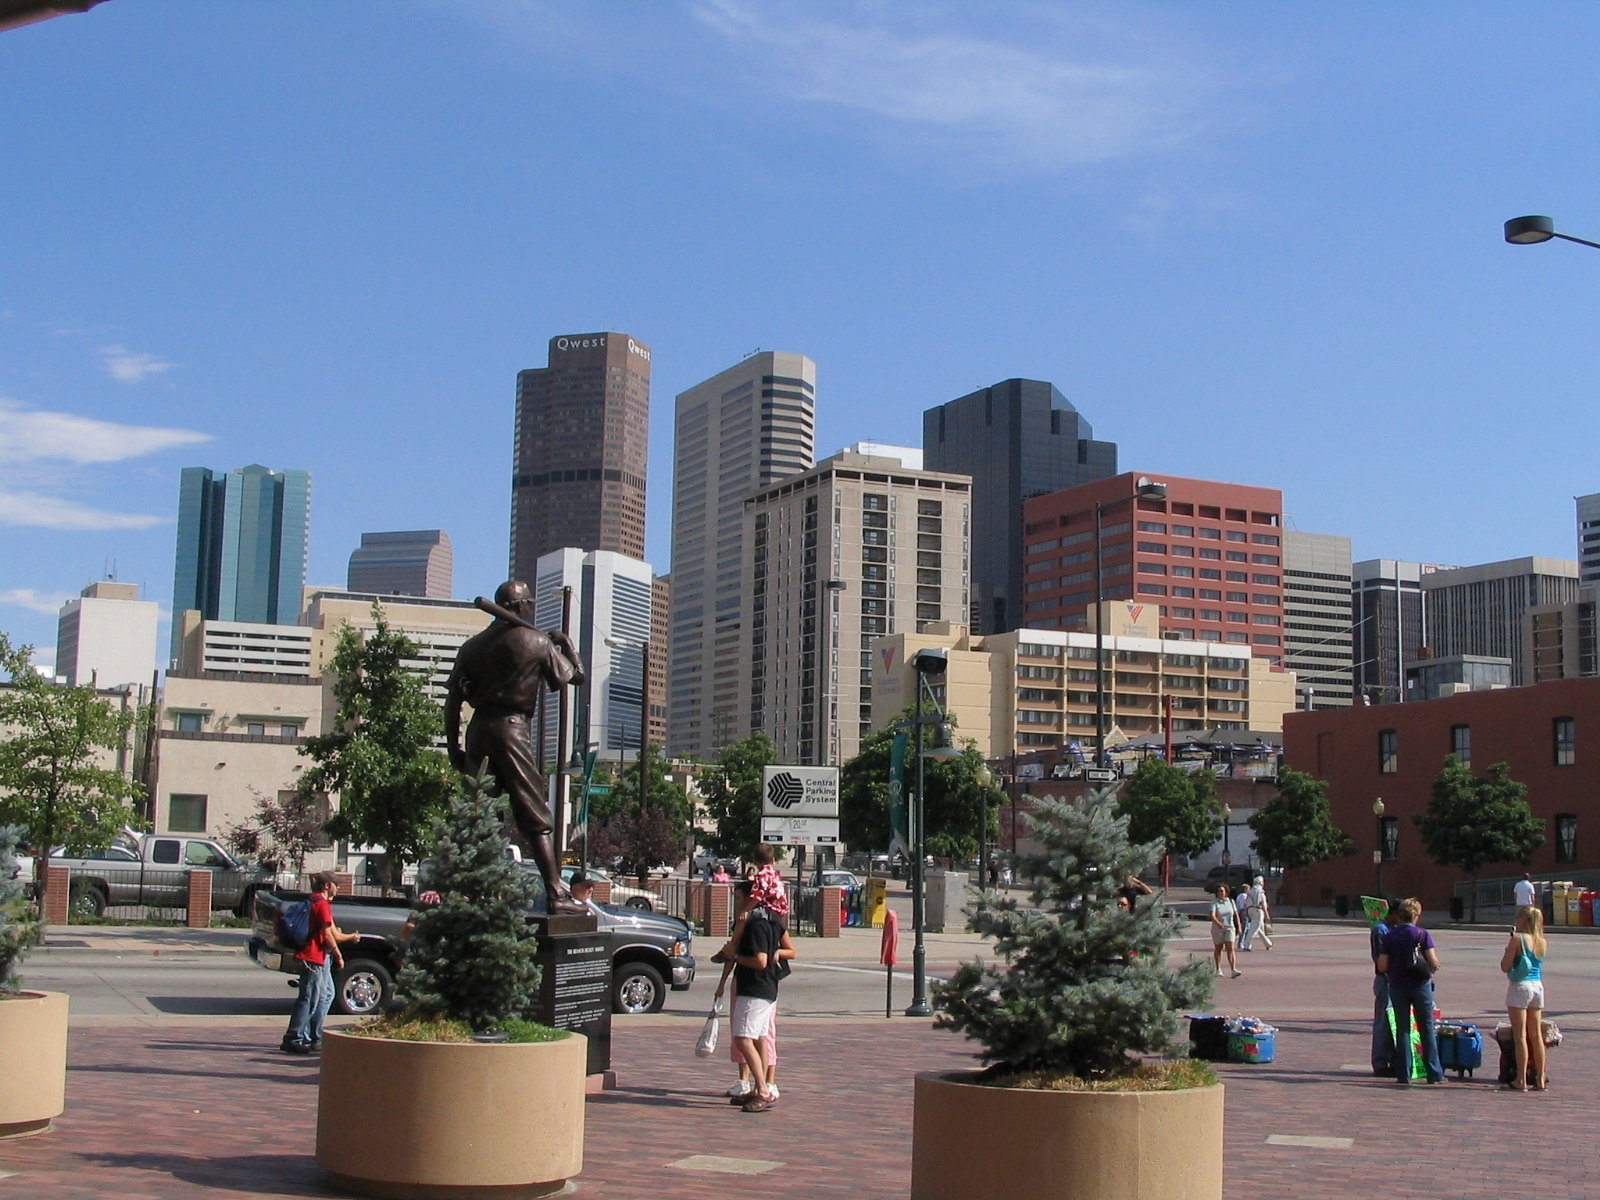
#90: Denver, CO (43.48)
Cost of Ownership & Maintenance: 69
Traffic & Infrastructure: 87
Safety: 86
Access to Vehicles & Maintenance: 45
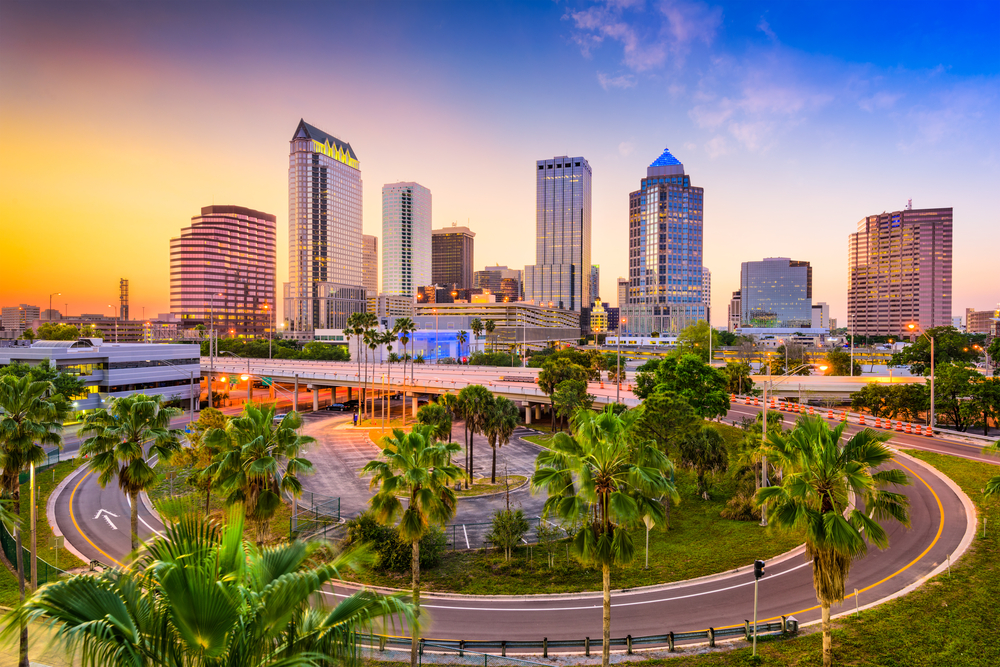
#9: Tampa, FL (60.66)
Cost of Ownership & Maintenance: 36
Traffic & Infrastructure: 24
Safety: 41
Access to Vehicles & Maintenance: 4
#91: San Jose, CA (43.22)
Cost of Ownership & Maintenance: 97
Traffic & Infrastructure: 65
Safety: 34
Access to Vehicles & Maintenance: 78
 Eric Fredericks, CC BY-SA 2.0, Wikimedia Commons
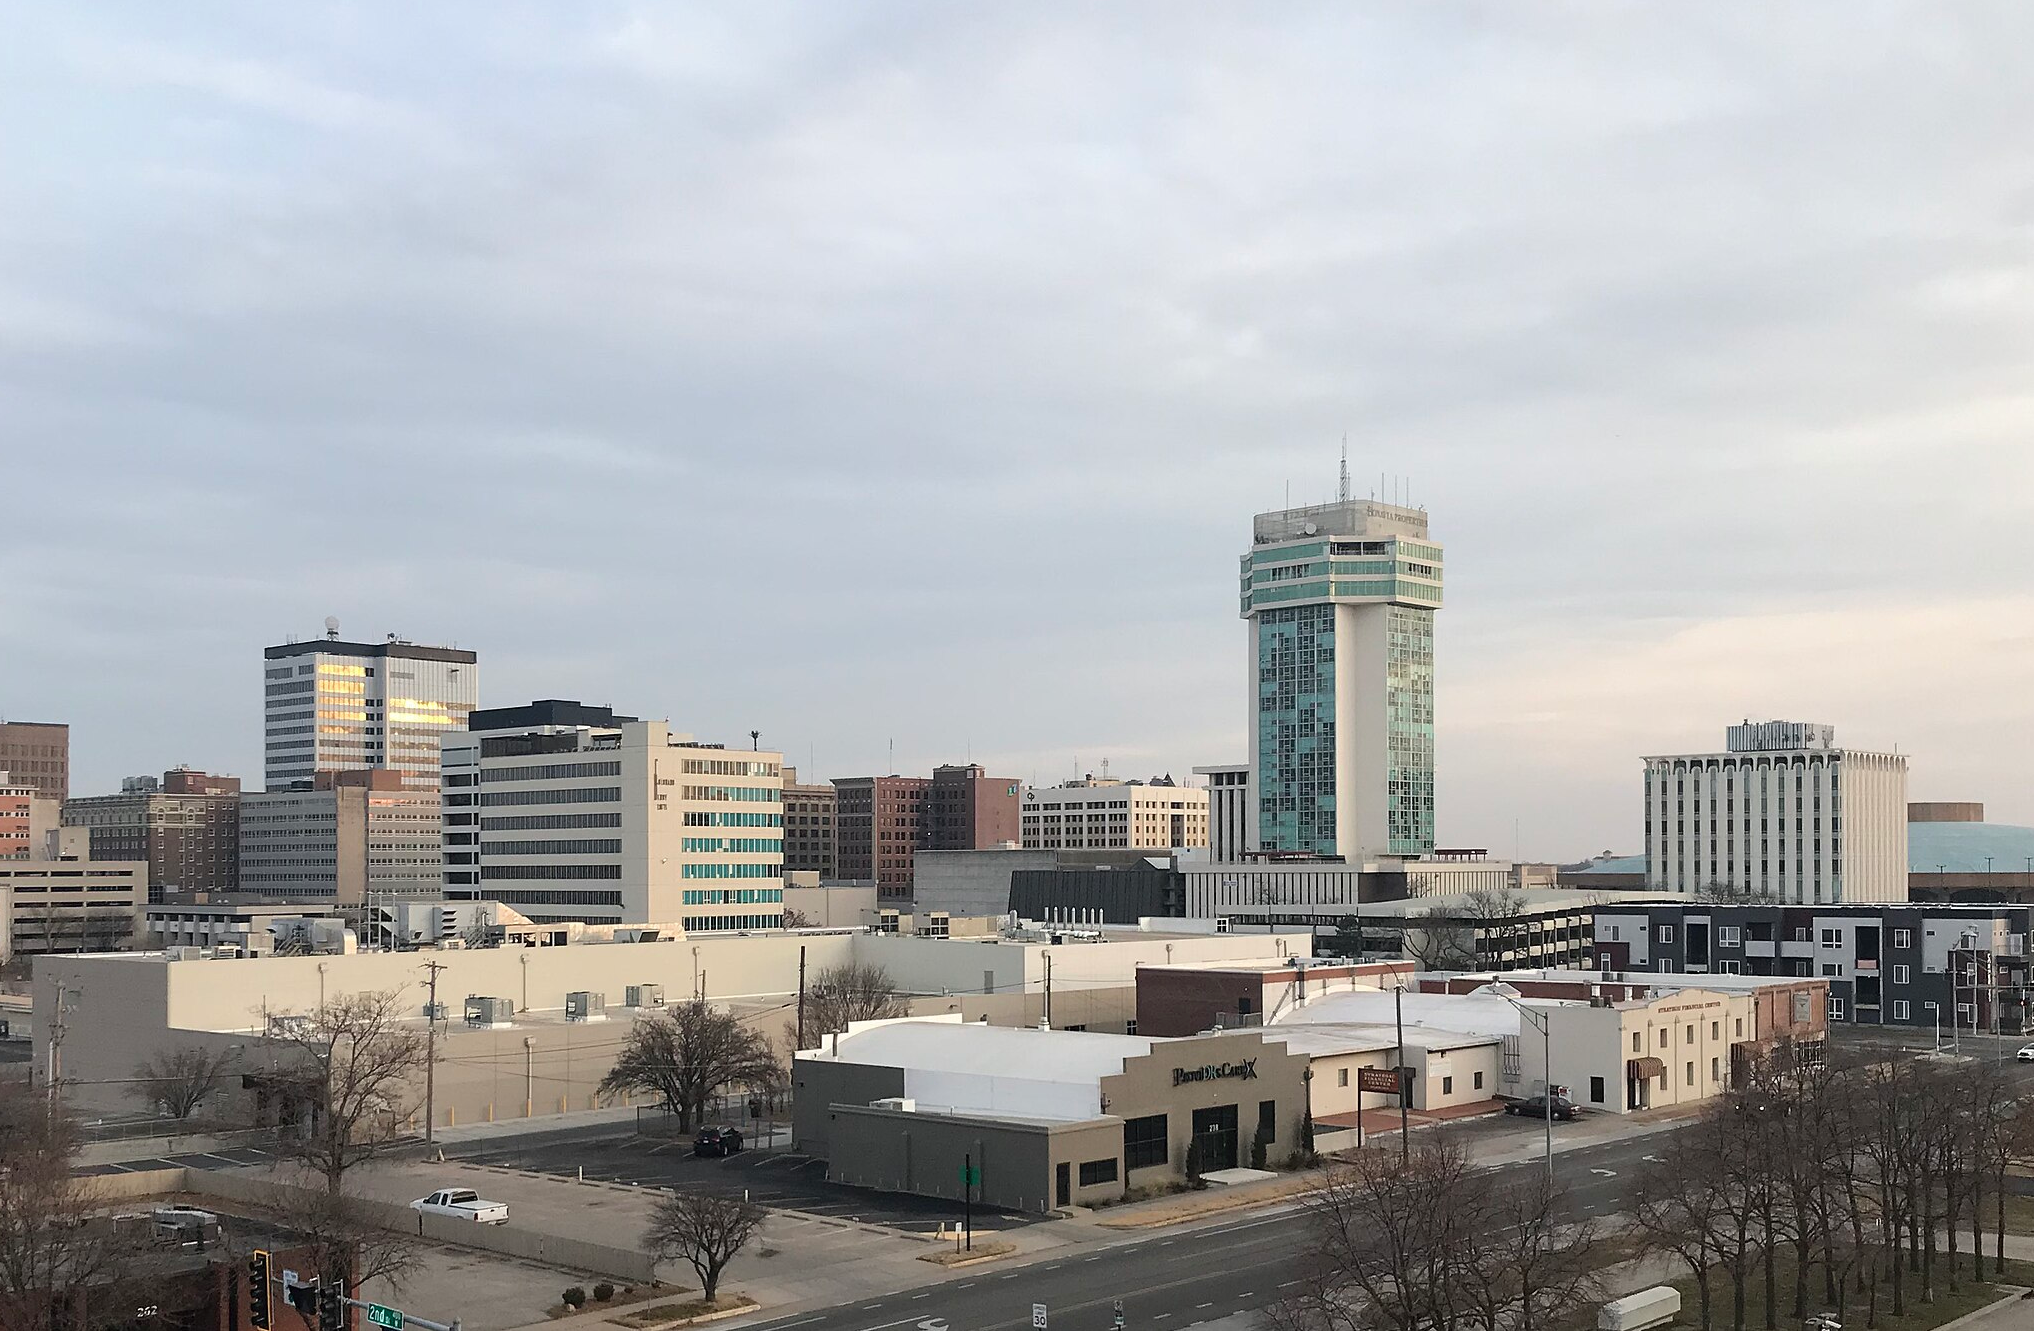
#8: Wichita, KS (61.39)
Cost of Ownership & Maintenance: 21
Traffic & Infrastructure: 6
Safety: 24
Access to Vehicles & Maintenance: 88
 WeaponizingArchitecture, CC BY-SA 4.0, Wikimedia Commons
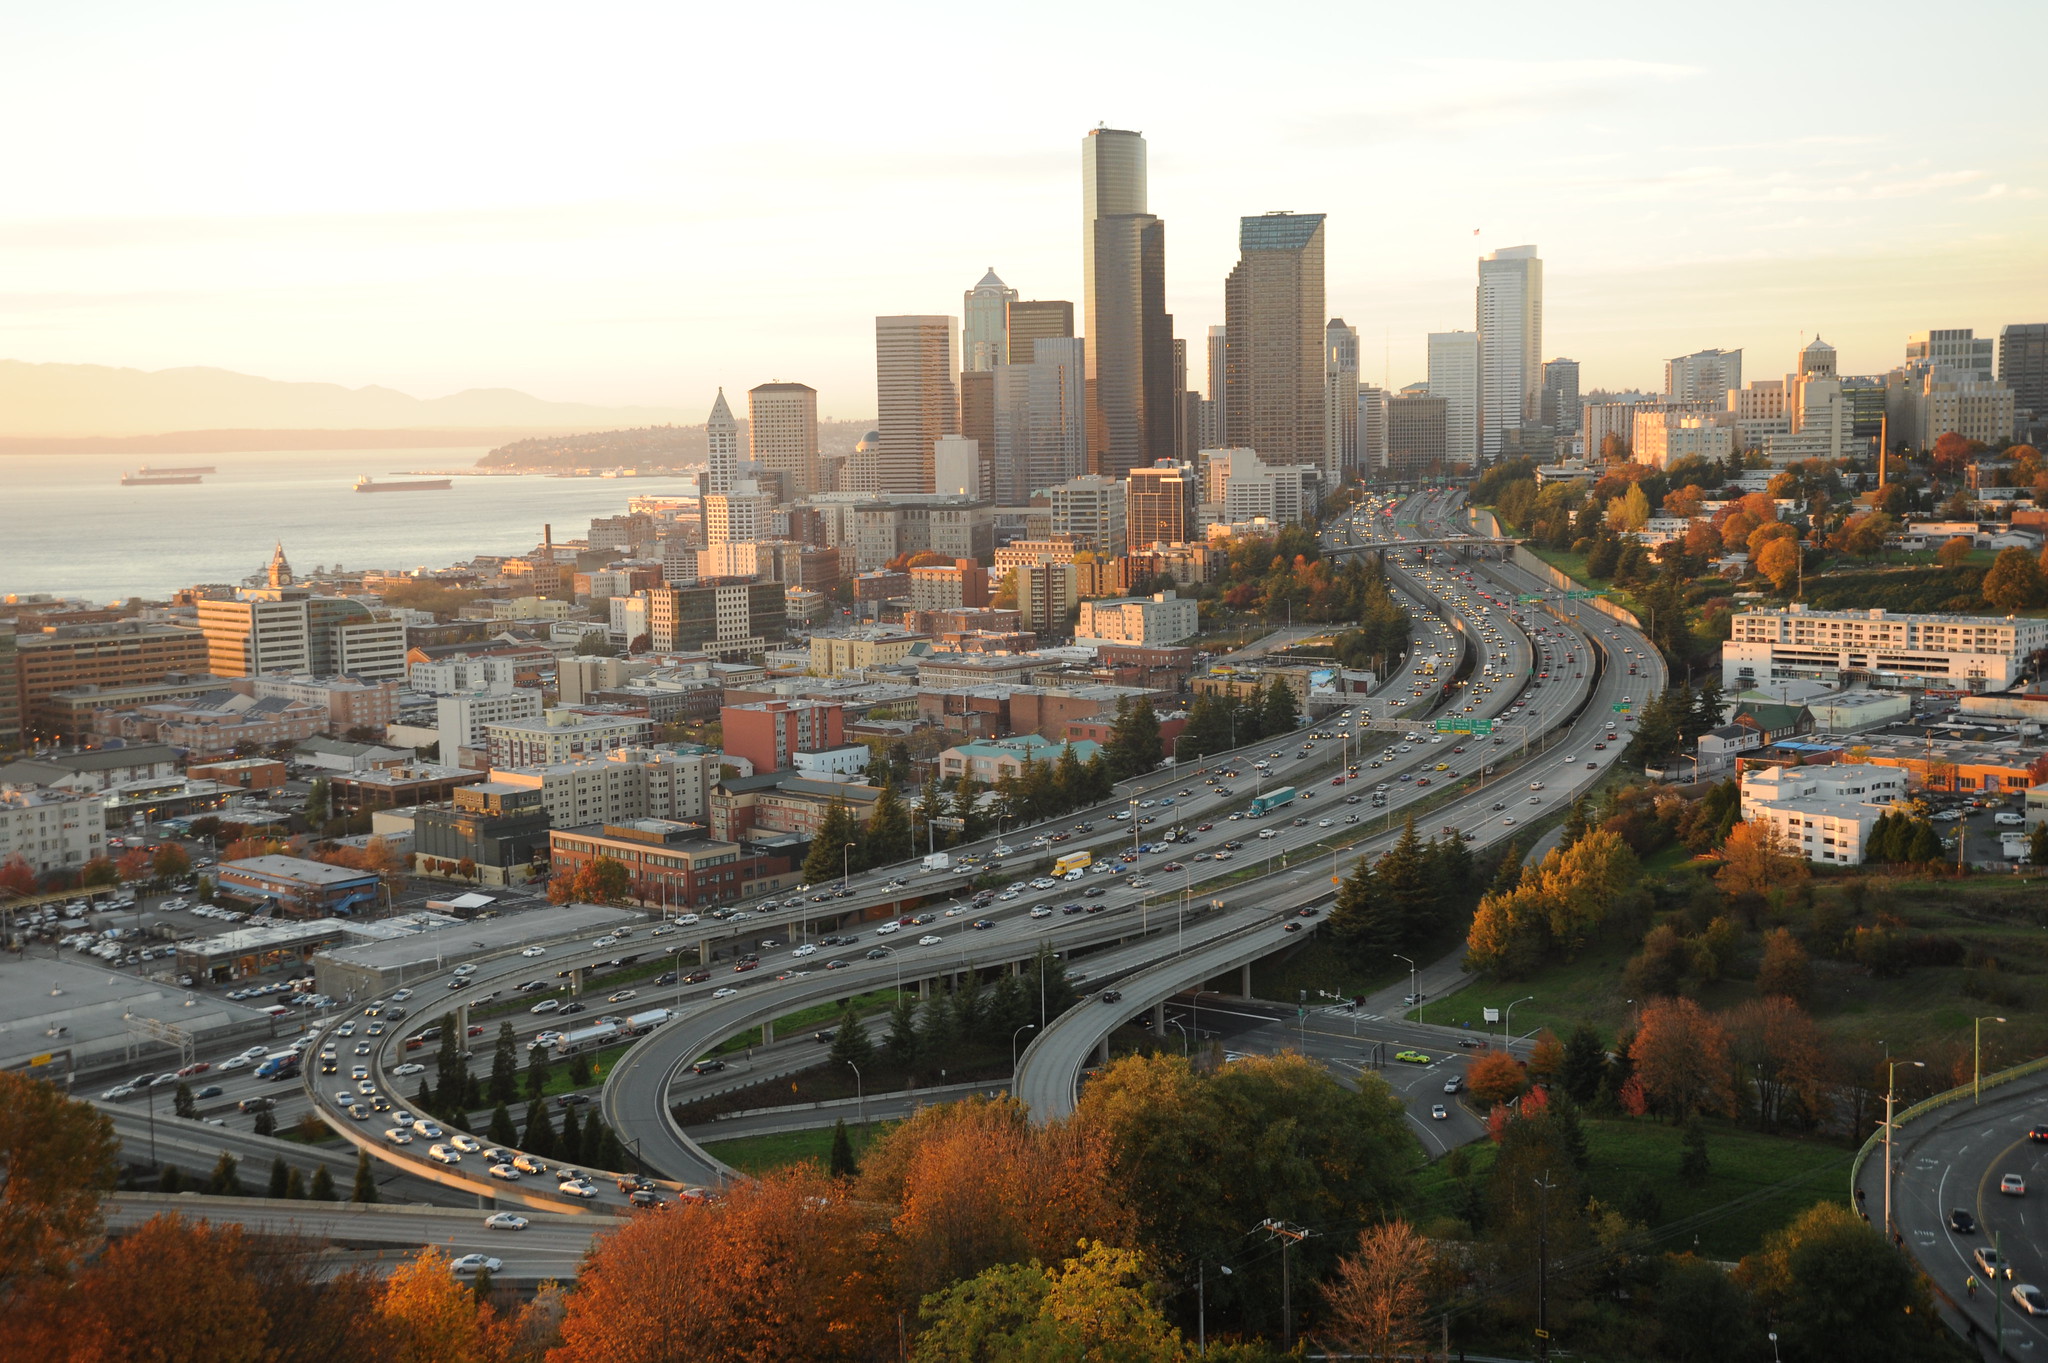
#92: Seattle, WA (42.59)
Cost of Ownership & Maintenance: 84
Traffic & Infrastructure: 81
Safety: 67
Access to Vehicles & Maintenance: 84
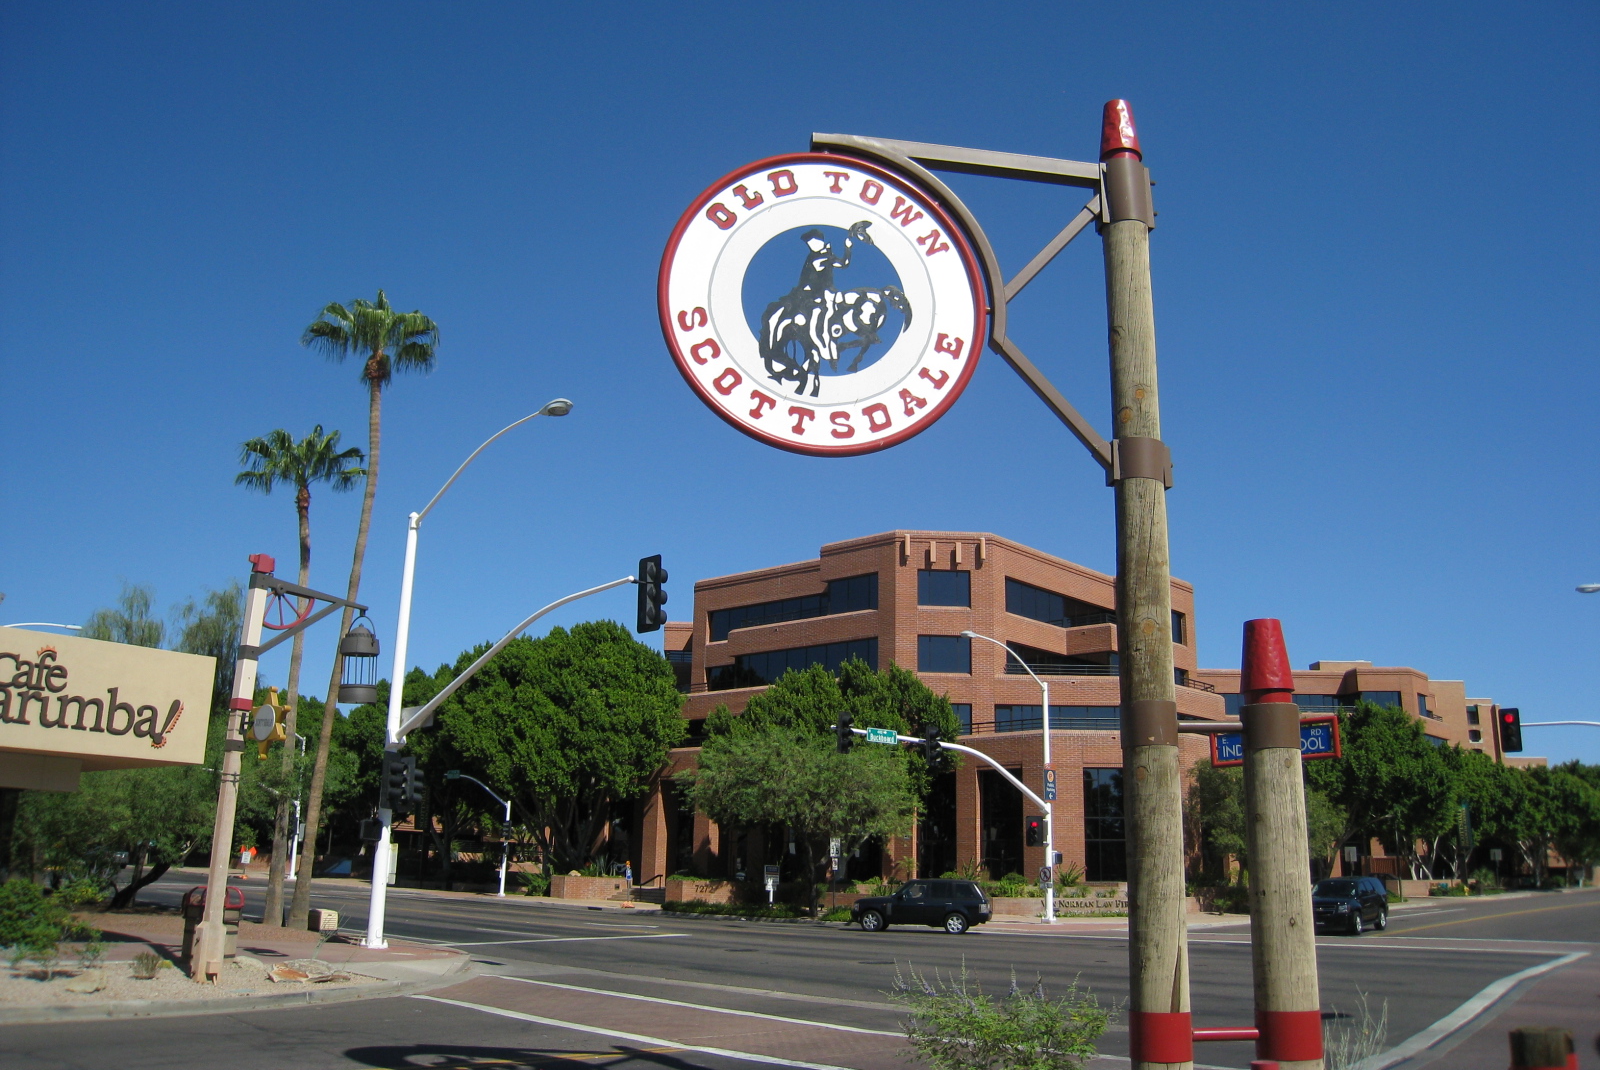
#7: Scottsdale, AZ (62.04)
Cost of Ownership & Maintenance: 61
Traffic & Infrastructure: 1
Safety: 8
Access to Vehicles & Maintenance: 25
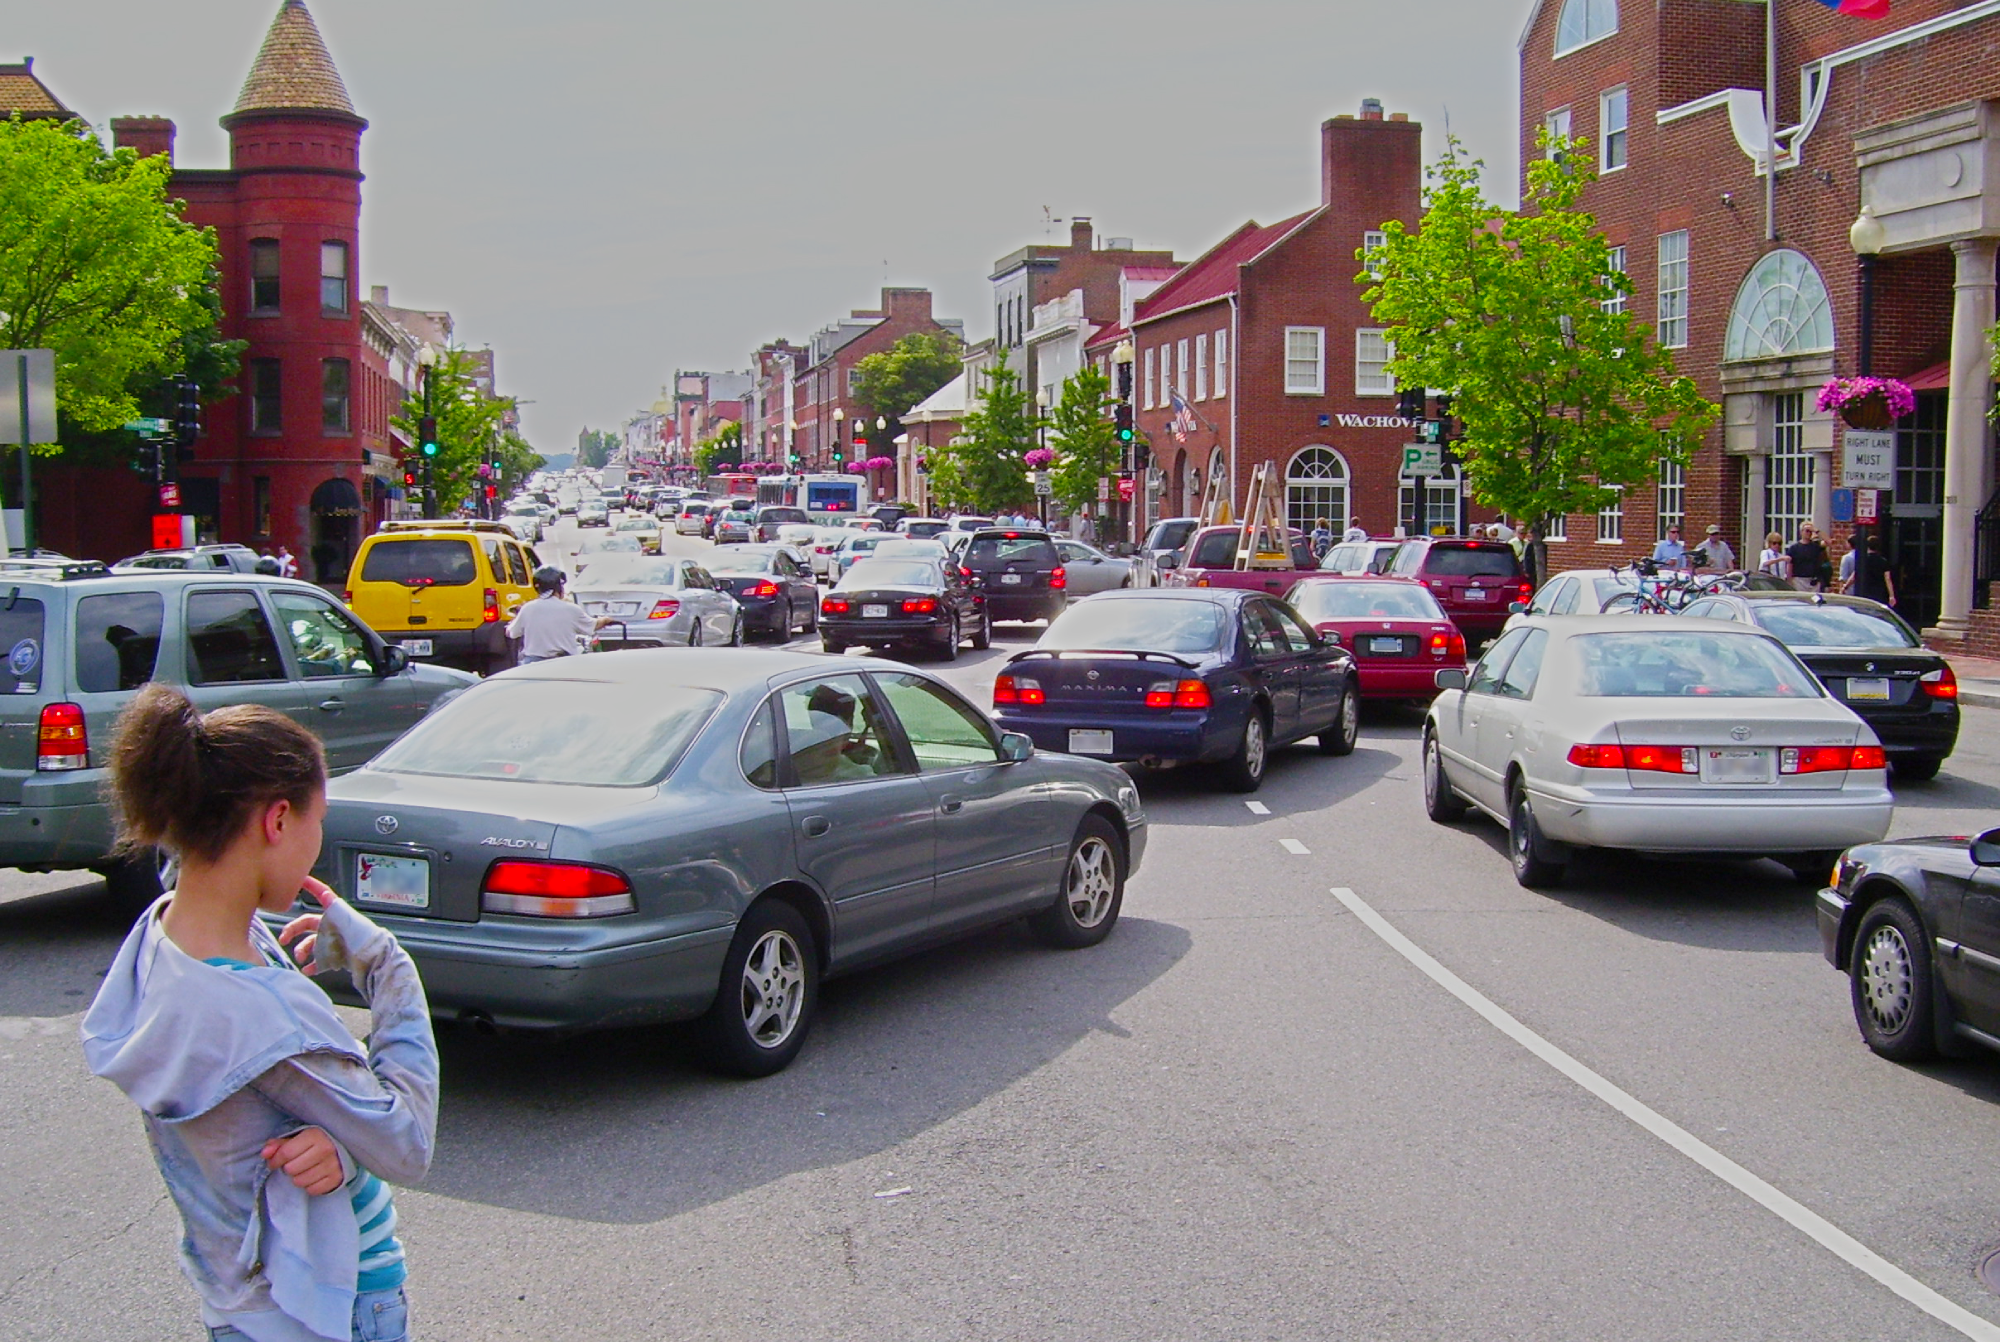
#93: Washington, DC (39.41)
Cost of Ownership & Maintenance: 62
Traffic & Infrastructure: 97
Safety: 94
Access to Vehicles & Maintenance: 75
 Ericjonesdotcom, CC BY-SA 3.0, Wikimedia Commons
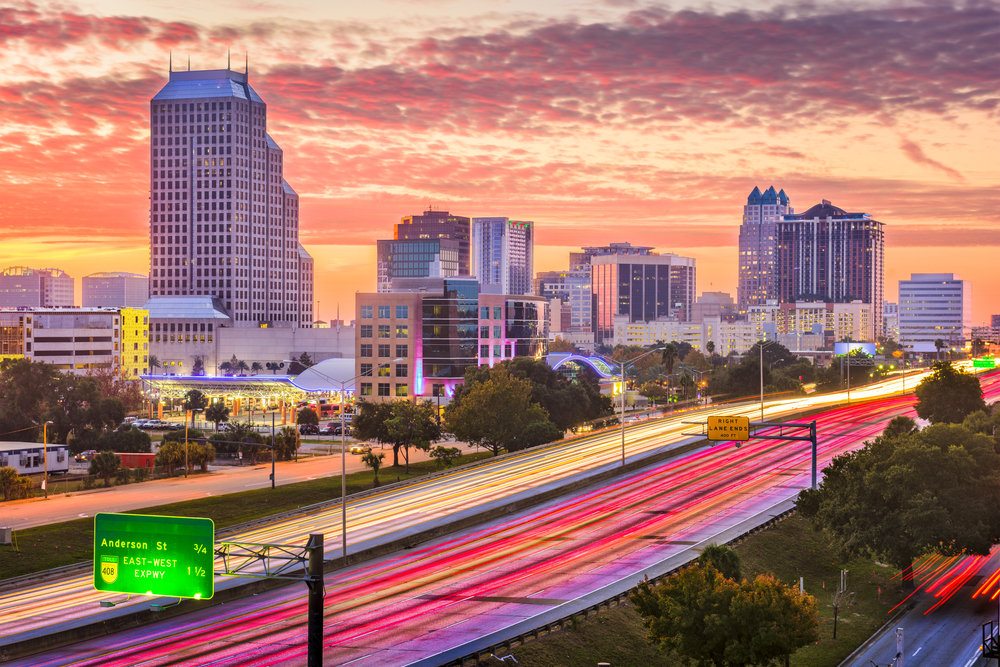
#6: Orlando, FL (62.06)
Cost of Ownership & Maintenance: 37
Traffic & Infrastructure: 2
Safety: 69
Access to Vehicles & Maintenance: 2
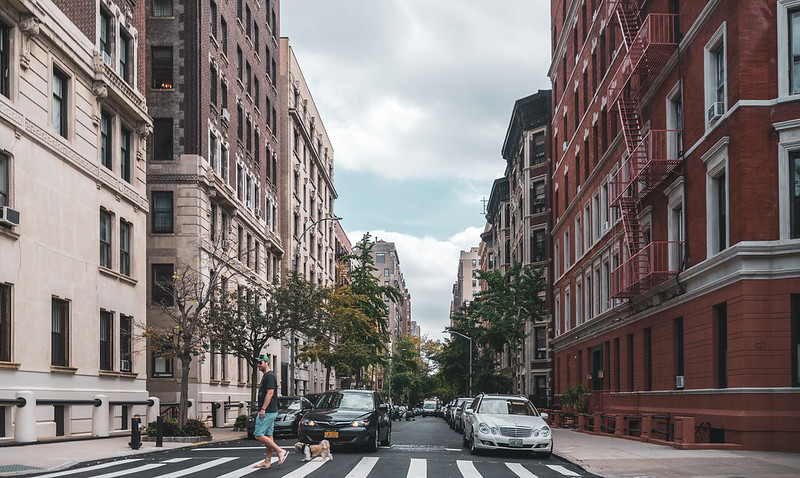
#94: New York, NY (38.02)
Cost of Ownership & Maintenance: 90
Traffic & Infrastructure: 100
Safety: 20
Access to Vehicles & Maintenance: 80
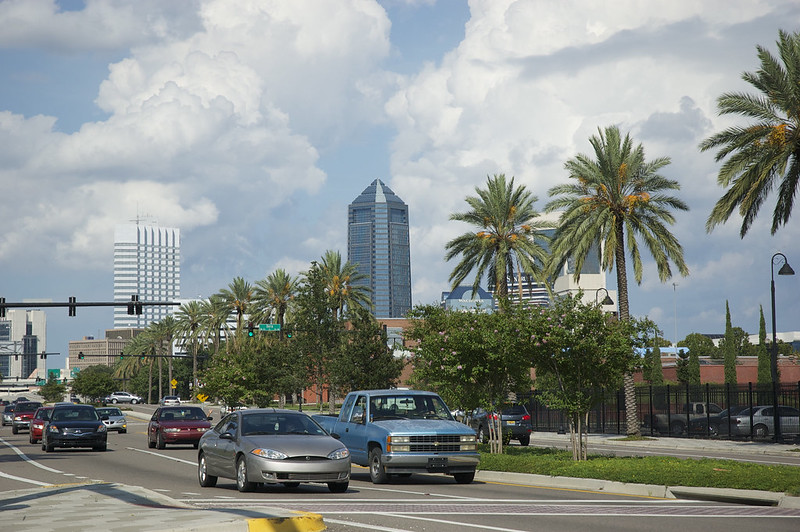
#5: Jacksonville, FL (62.46)
Cost of Ownership & Maintenance: 4
Traffic & Infrastructure: 21
Safety: 39
Access to Vehicles & Maintenance: 34
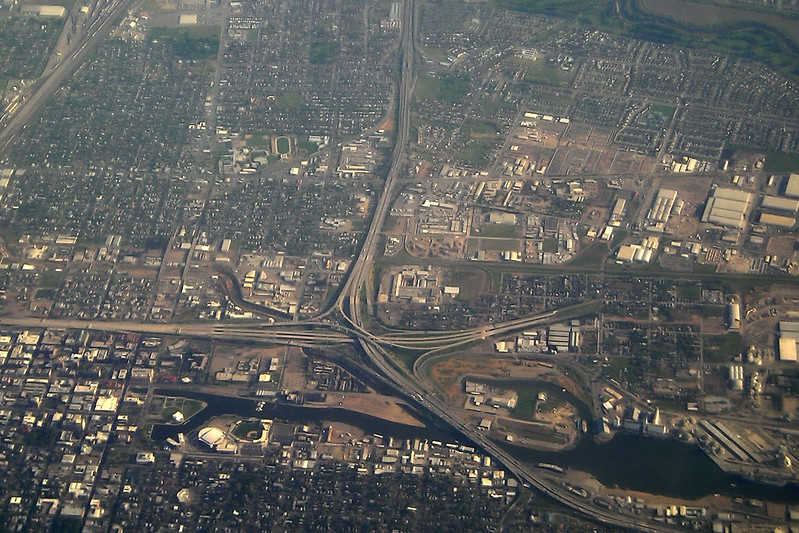
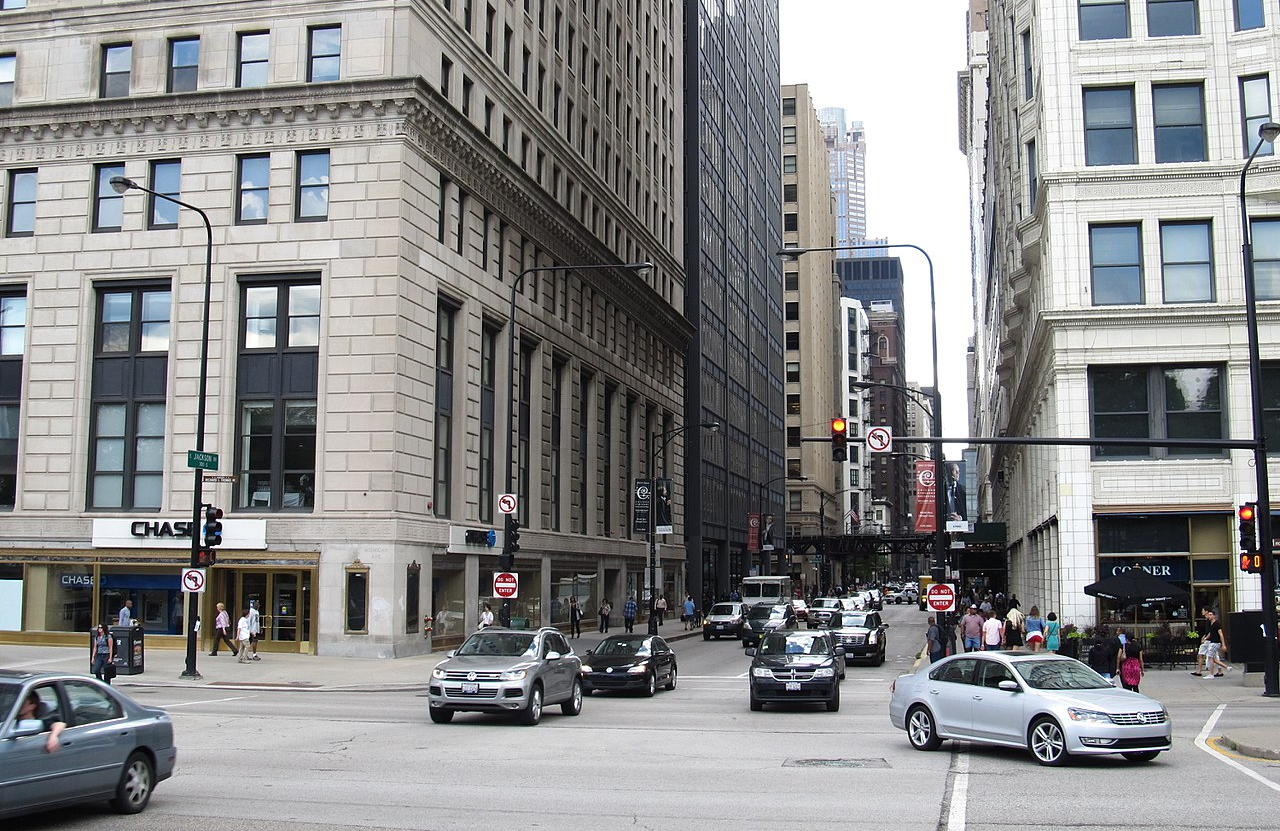
#95: Chicago, IL (37.20)
Cost of Ownership & Maintenance: 89
Traffic & Infrastructure: 99
Safety: 56
Access to Vehicles & Maintenance: 46
 Ken Lund, CC BY-SA 2.0, Wikimedia Commons
#4: Greensboro, NC (62.63)
Cost of Ownership & Maintenance: 1
Traffic & Infrastructure: 18
Safety: 64
Access to Vehicles & Maintenance: 35
 Warren LeMay, CC0, Wikimedia Commons
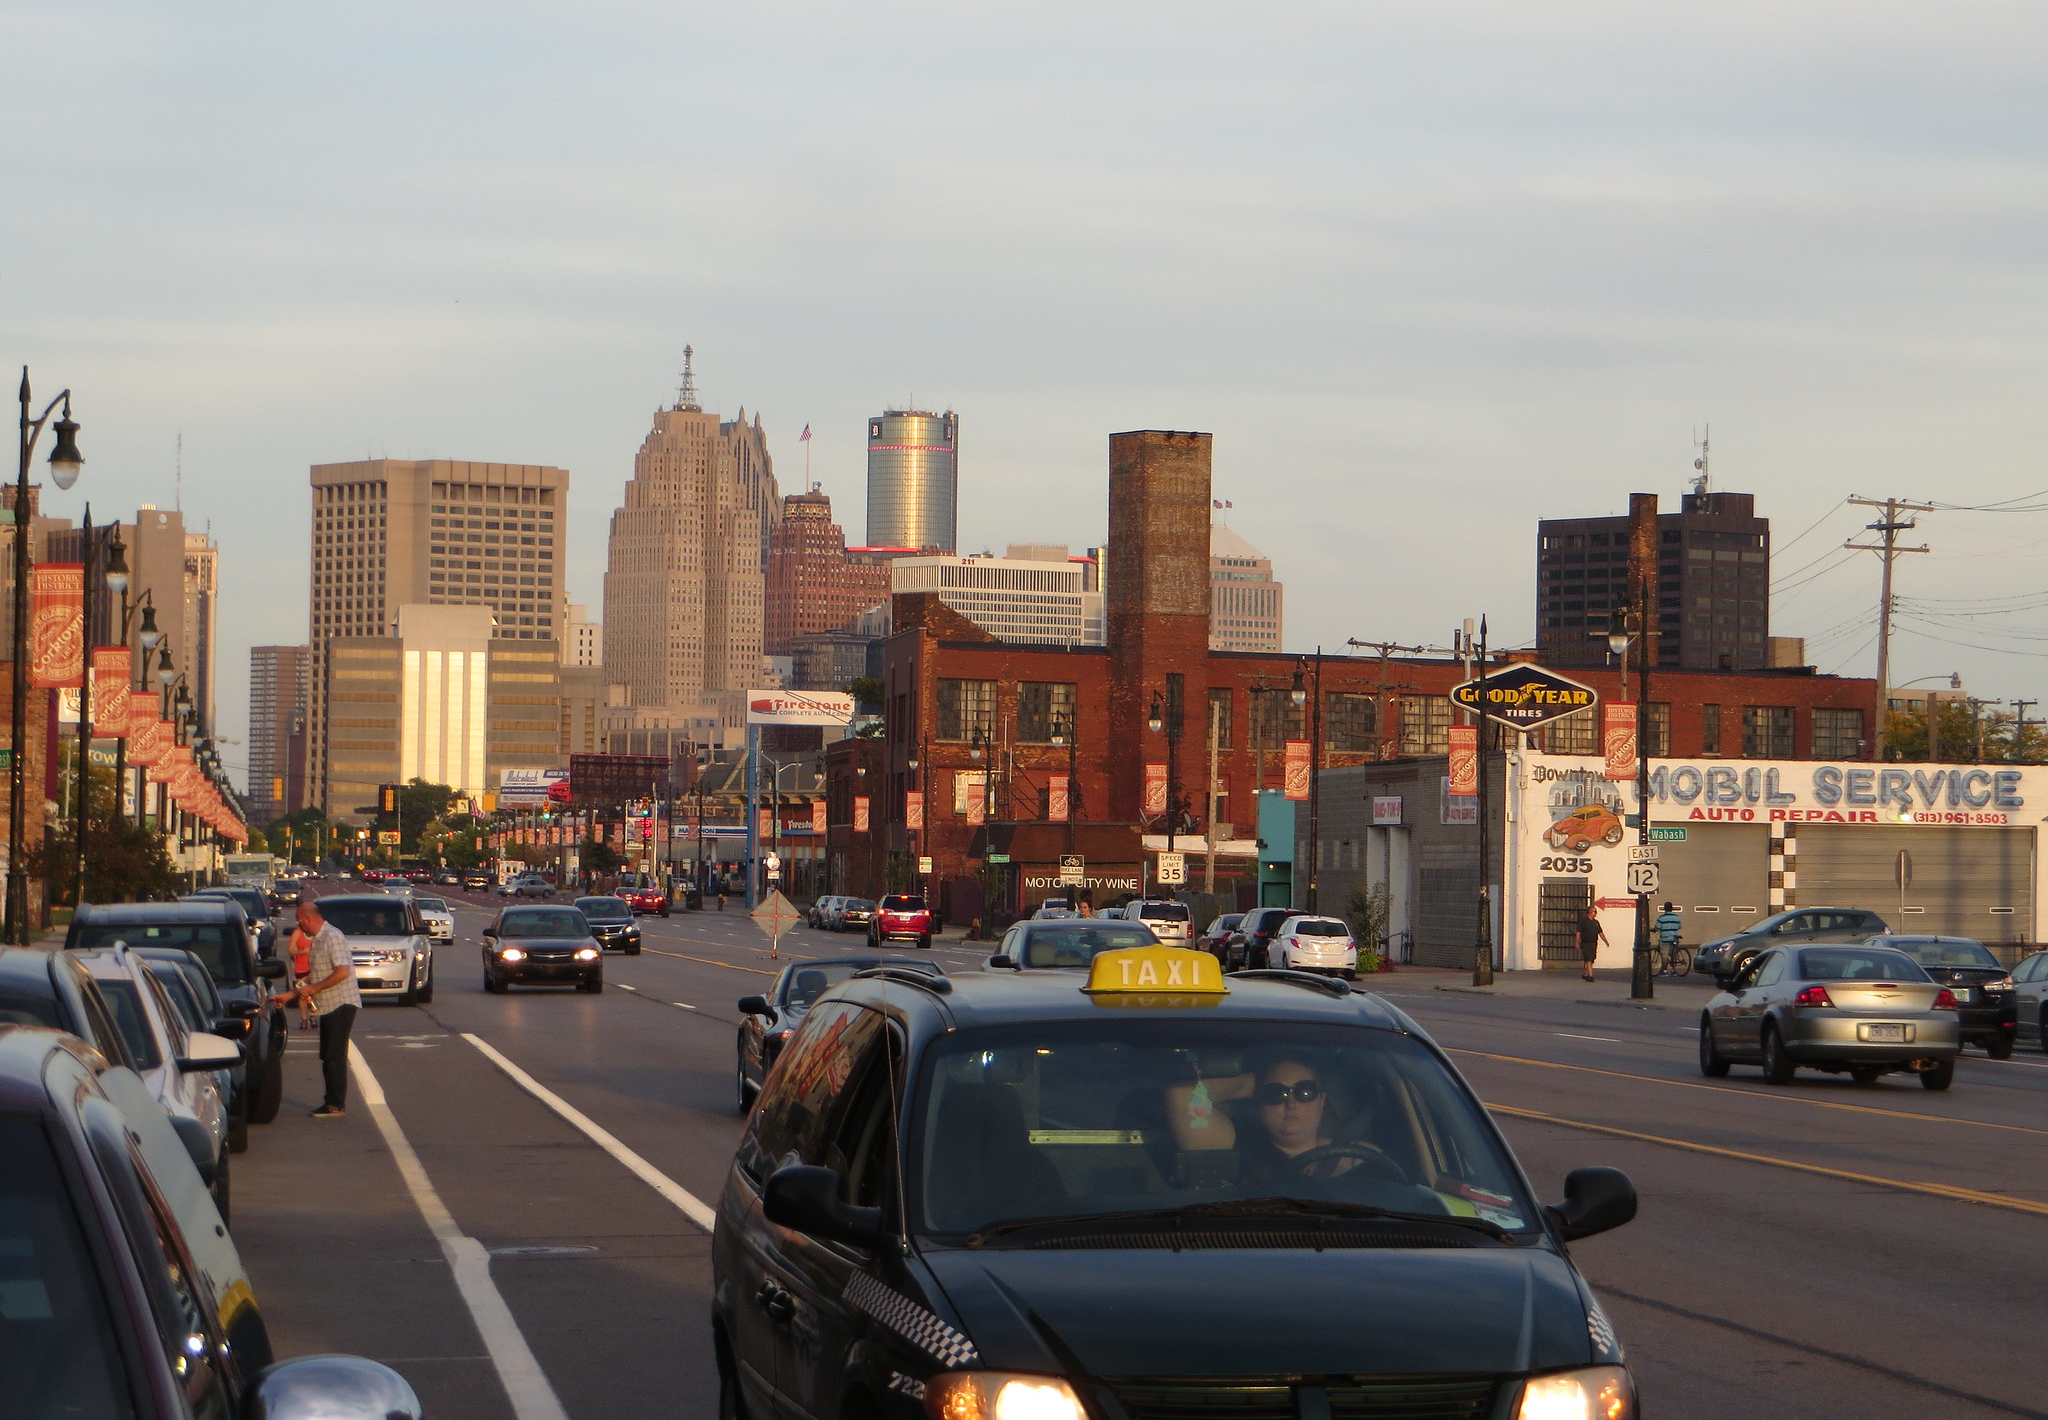
#96: Detroit, MI (36.85)
Cost of Ownership & Maintenance: 77
Traffic & Infrastructure: 89
Safety: 99
Access to Vehicles & Maintenance: 50
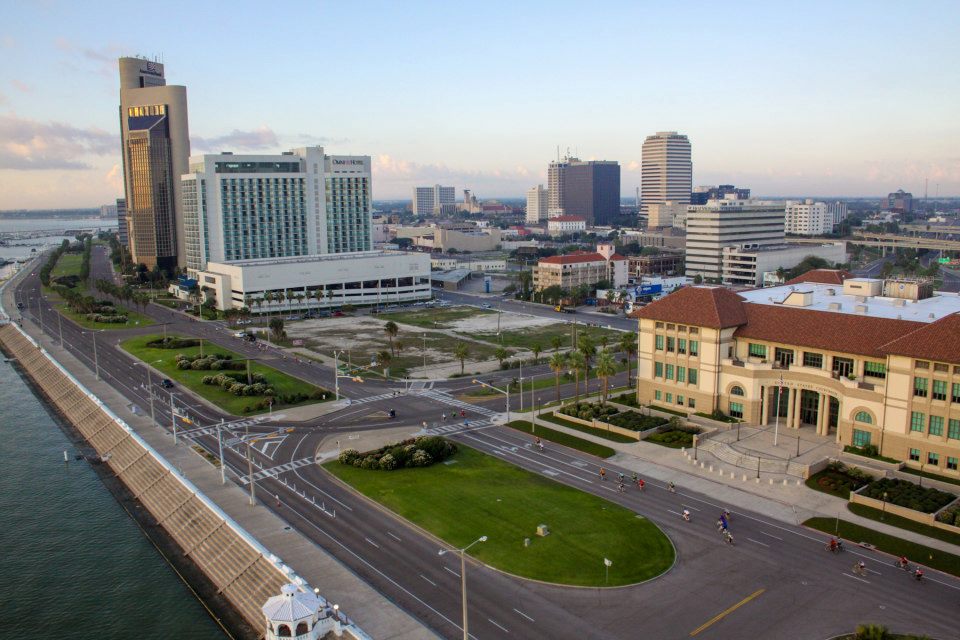
#3: Corpus Christi, TX (62.94)
Cost of Ownership & Maintenance: 10
Traffic & Infrastructure: 8
Safety: 16
Access to Vehicles & Maintenance: 86
 Mglsndst1993, CC BY-SA 3.0, Wikimedia Commons
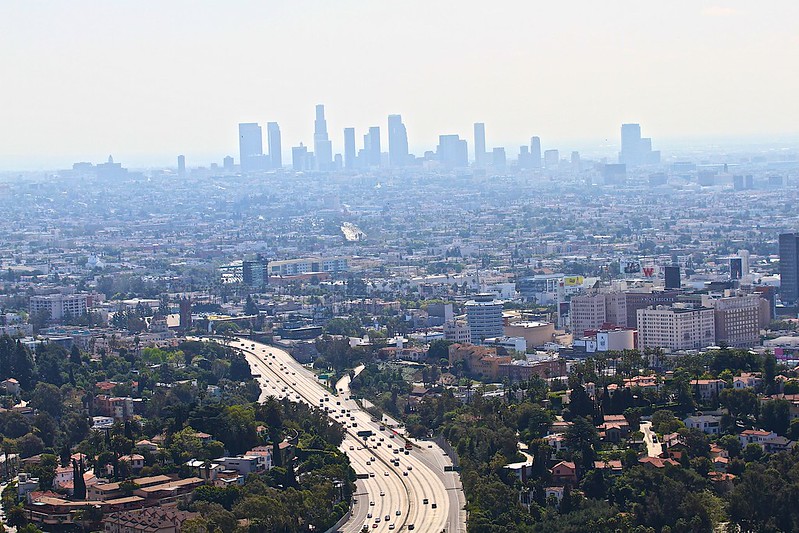
#97: Los Angeles, CA (36.57)
Cost of Ownership & Maintenance: 99
Traffic & Infrastructure: 91
Safety: 61
Access to Vehicles & Maintenance: 44
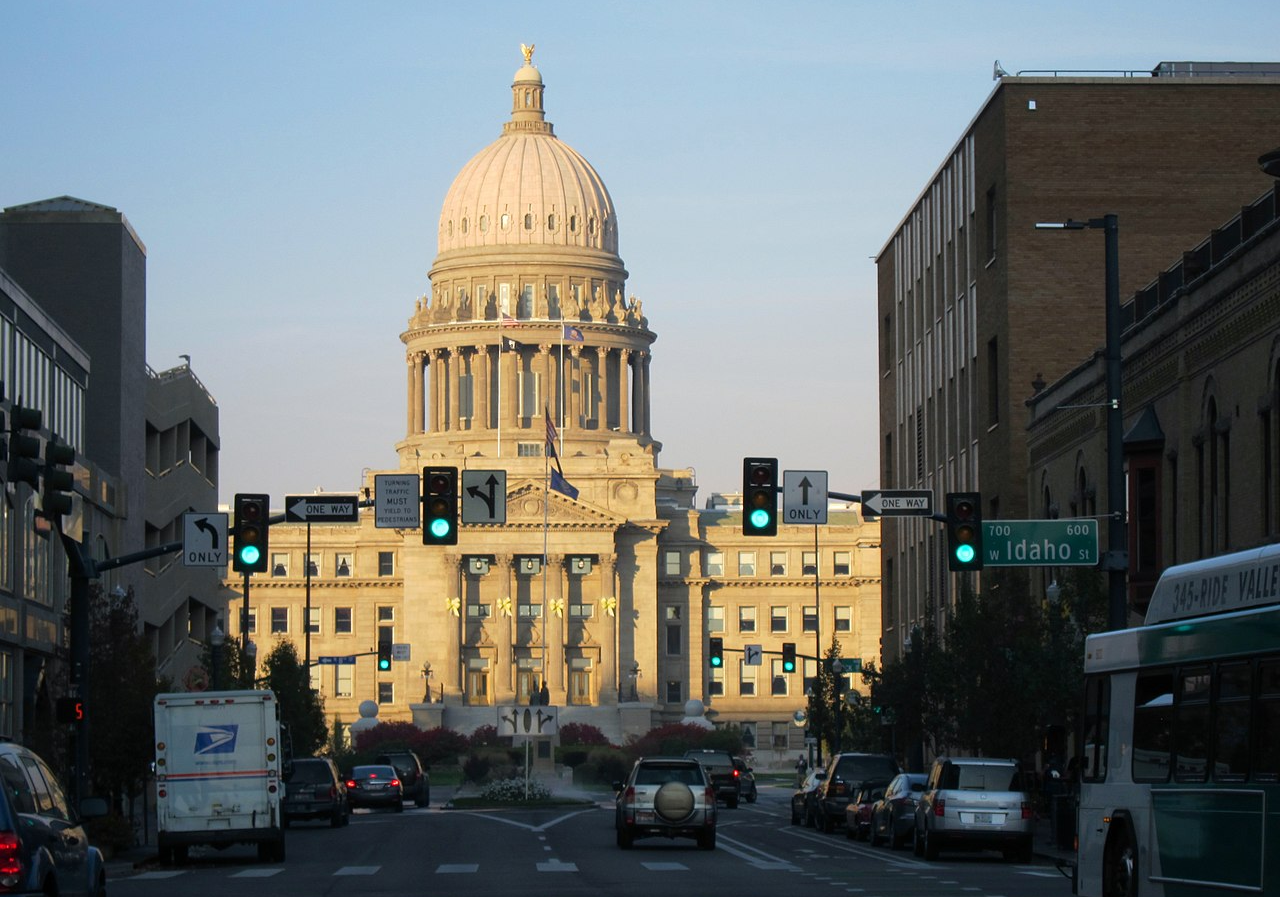
#2: Boise, ID (63.41)
Cost of Ownership & Maintenance: 26
Traffic & Infrastructure: 23
Safety: 1
Access to Vehicles & Maintenance: 81
 Roman Eugeniusz, CC BY-SA 3.0, Wikimedia Commons
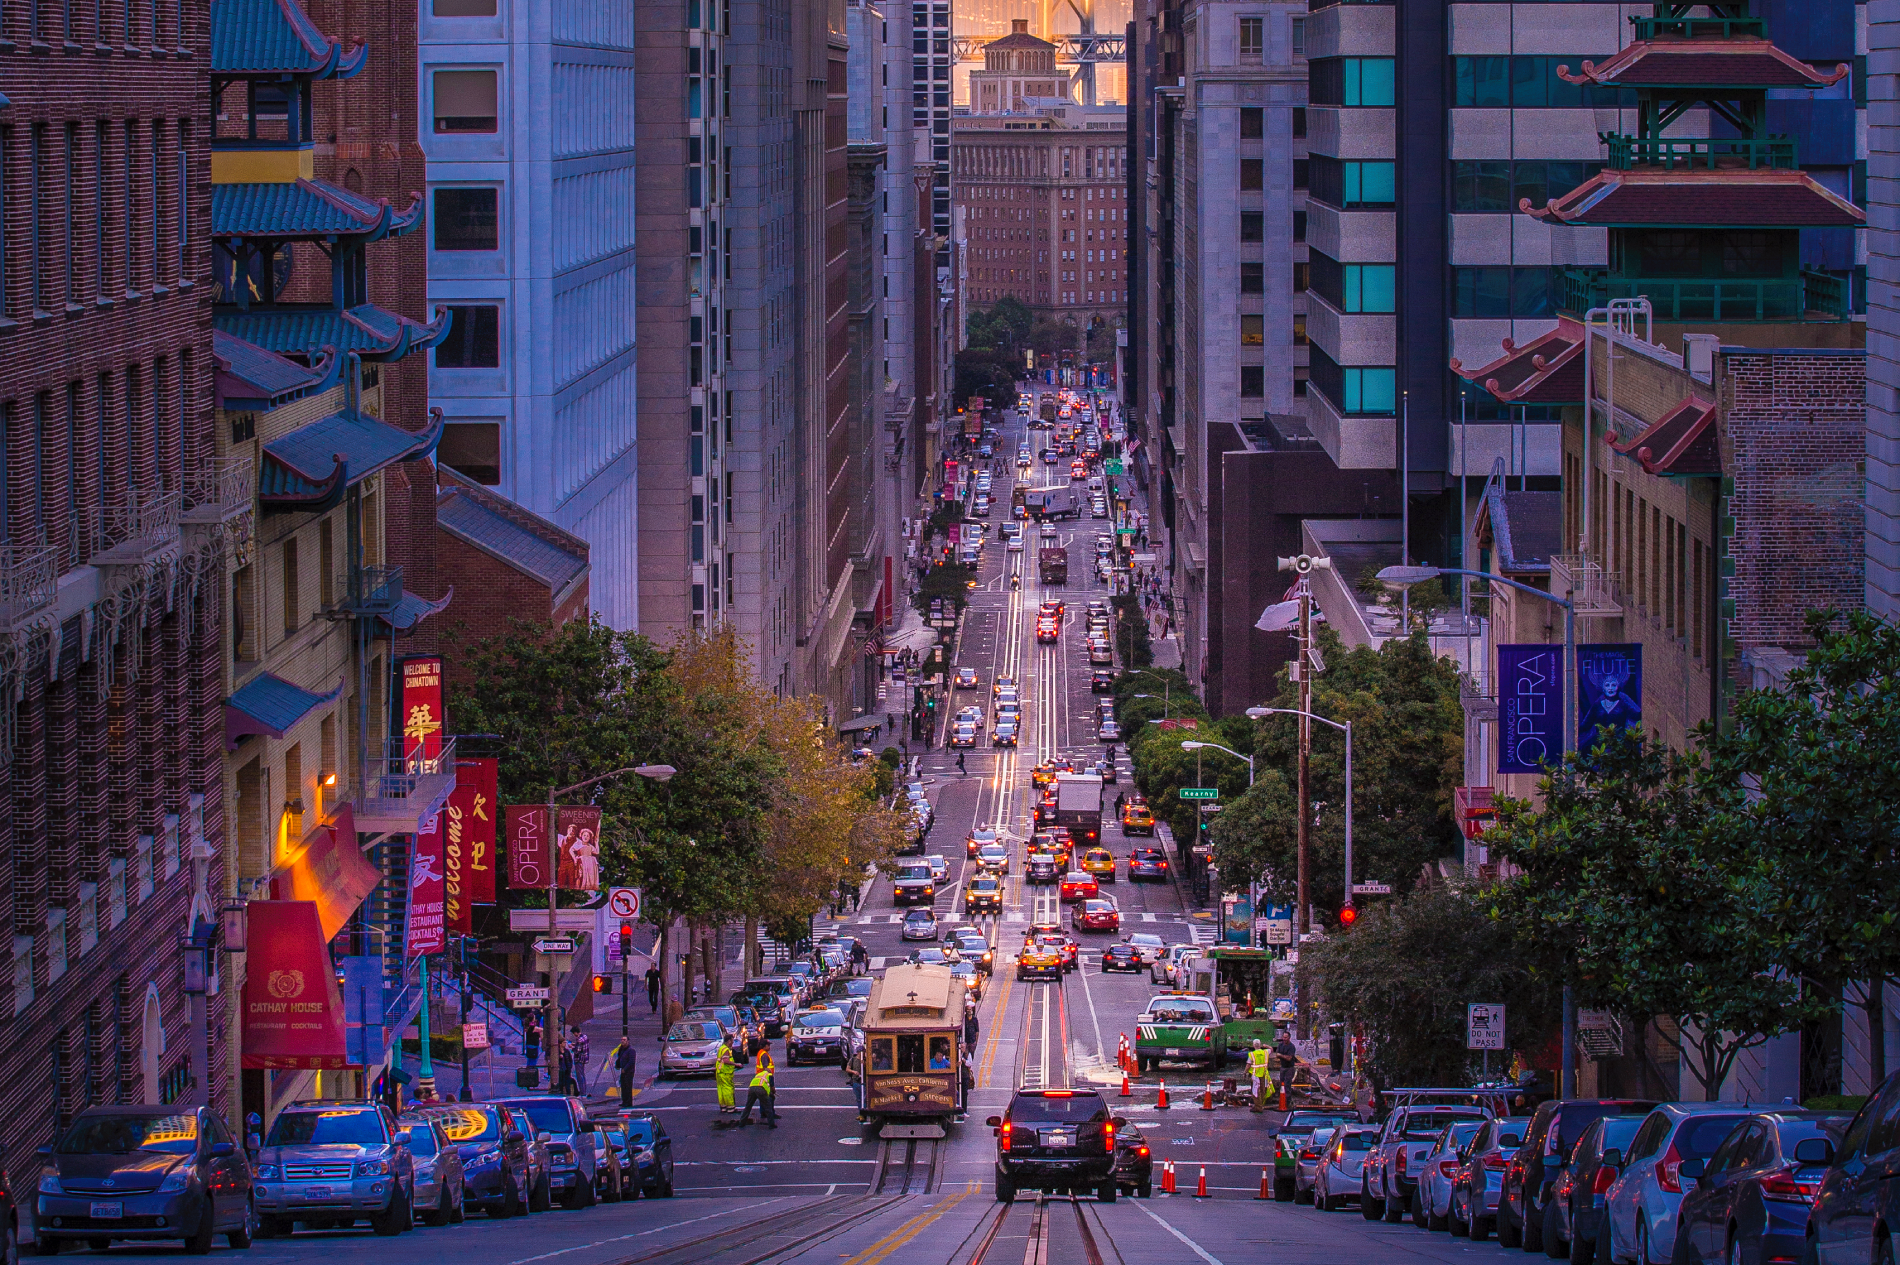
#98: San Francisco, CA (36.20)
Cost of Ownership & Maintenance: 94
Traffic & Infrastructure: 93
Safety: 77
Access to Vehicles & Maintenance: 60
 Rezaul Karim, CC0, Wikimedia Commons
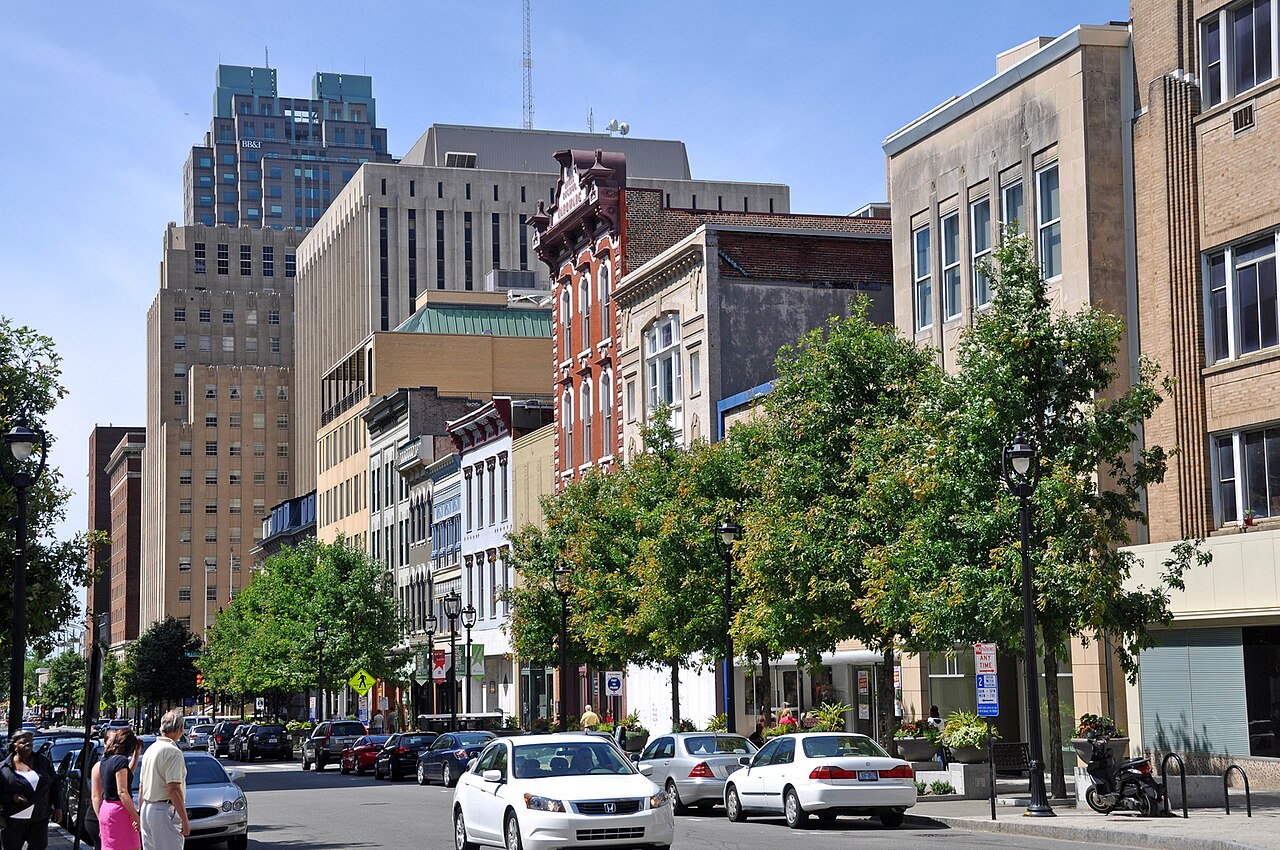
#1: Raleigh, NC (63.92)
Cost of Ownership & Maintenance: 2
Traffic & Infrastructure: 33
Safety: 22
Access to Vehicles & Maintenance: 30
 Bz3rk, CC BY-SA 3.0, Wikimedia Commons
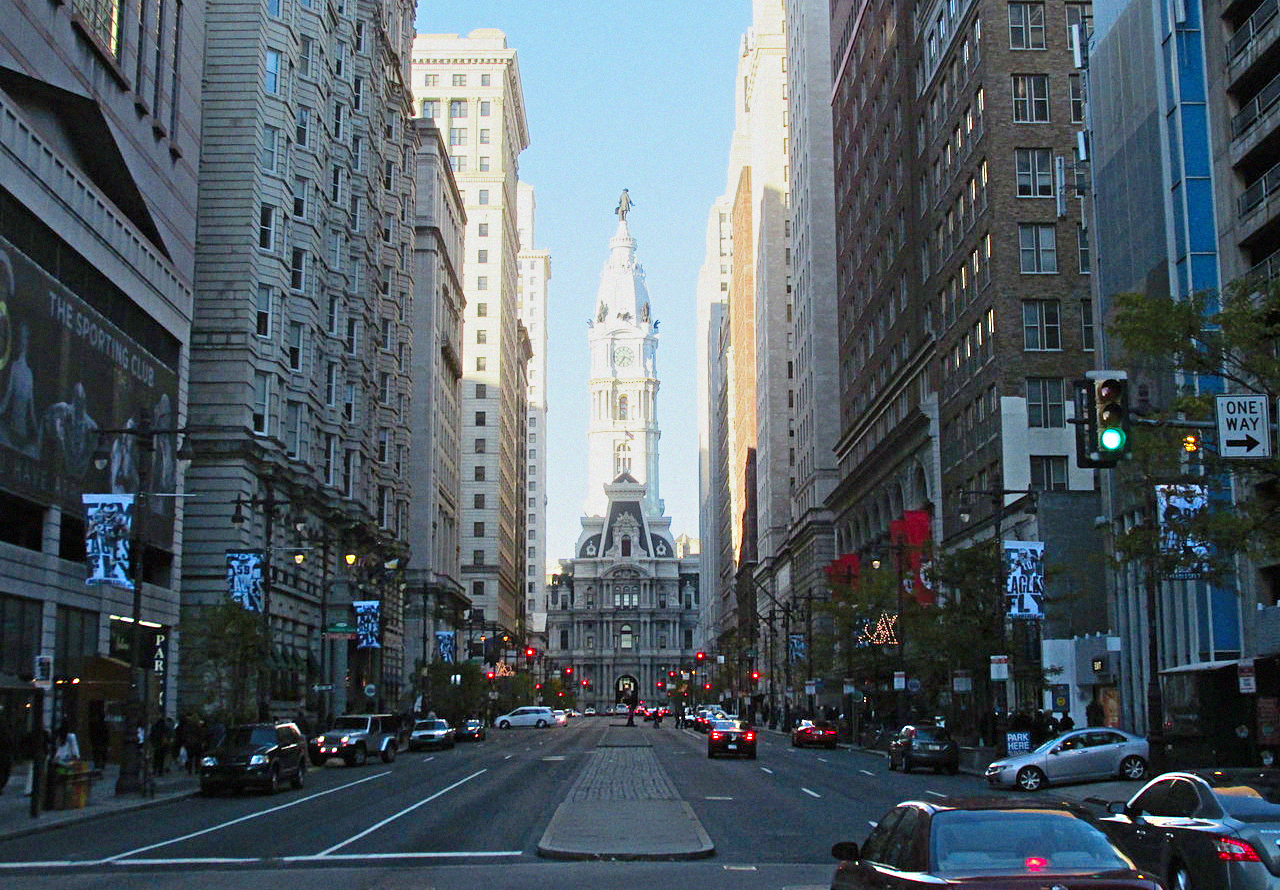
#99: Philadelphia, PA (35.70)
Cost of Ownership & Maintenance: 81
Traffic & Infrastructure: 96
Safety: 93
Access to Vehicles & Maintenance: 76
 John Phelan, CC BY-SA 3.0, Wikimedia Commons
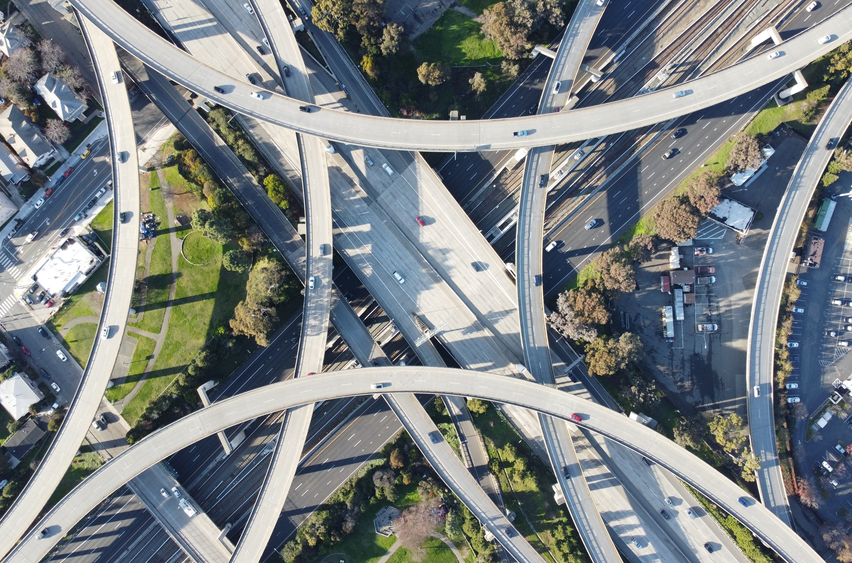
#100: Oakland, CA (32.75)
Cost of Ownership & Maintenance: 100
Traffic & Infrastructure: 79
Safety: 95
Access to Vehicles & Maintenance: 51
 Wirestock Creators, Shutterstock

_from_the_Morgan_State_University_pedestrian_overpass_in_Baltimore,_Maryland.jpg)
,_Embarcadero_--_2012_--_5405.jpg)
.jpg)
.jpg)
.jpg)
.jpg)
.jpg)